
Introduction
Most machine shops know their machines are running—but few know how well. When gut-feel management drives production decisions, hidden inefficiencies multiply silently: unplanned downtime consumes capacity, missed deadlines strain customer relationships, and profit margins erode faster than anyone realizes. The gap between "machines are busy" and "machines are productive" costs manufacturers dearly—unplanned downtime alone drains up to $852 million weekly from U.S. manufacturers, with a single hour averaging $260,000 in losses.
Closing that gap starts with the right data. This guide covers the essential manufacturing KPIs every shop must track, how to calculate them accurately, and how to overcome data collection challenges across mixed machine fleets—including legacy equipment.
Whether you're running modern CNCs or decades-old mills, you'll learn how to build real-time visibility into your operation and make decisions based on data, not instinct.
TLDR:
- Track five critical KPIs: OEE, Production Efficiency, Downtime Rate, First Pass Yield, and On-Time Delivery
- Manual data collection creates 10-30% OEE calculation errors and 24-hour reporting delays
- Universal IIoT platforms connect any machine—new or legacy—for automated real-time data capture
- Real-time dashboards enable 15-25% OEE improvements within months by revealing hidden losses
- Top 20% of downtime causes drive 80% of production losses — fix those first
What Is Manufacturing Performance Tracking — and Why Does It Matter?
Manufacturing performance tracking is the systematic process of measuring how effectively a facility uses its equipment, labor, materials, and time to produce quality output. This goes far beyond simply counting parts produced—it requires understanding why production numbers are what they are and where capacity is being lost.
Metrics vs. KPIs: Understanding the Difference
Most shops collect metrics (raw data points like "150 units produced per hour"), but few elevate them to strategic KPIs (metrics tied to specific business targets like "achieve 150 units/hour to hit quarterly revenue goals"). The distinction matters: metrics tell you what happened, while KPIs tell you whether what happened is good enough to meet your business objectives.
A metric becomes a KPI when you attach it to a performance threshold that drives action. Without that connection to business goals, you're just accumulating numbers.
The Business Cost of Not Tracking Performance
The financial impact of poor visibility is measurable — and consistent across the industry:
- Manufacturing facilities lose 5-20% of annual productivity to unplanned downtime
- Equipment failures account for 42% of total downtime, representing the highest-cost problem category
- Reactive maintenance strategies produce 3.3× more downtime and 16× more defects compared to preventive approaches
Beyond direct downtime costs, hidden capacity losses compound through micro-stops, slow cycles, and quality issues that manual tracking never captures. Research shows that 35% of capacity can vanish into these "Hidden Factory" elements—small inefficiencies that compound into massive productivity drains.
Without systematic tracking, these losses stay invisible until they've already affected output, margin, and on-time delivery. That's the case for getting measurement right from the start.
The 5 Most Critical Manufacturing KPIs to Track
1. Overall Equipment Effectiveness (OEE)
OEE is the single most comprehensive equipment performance metric in manufacturing. It combines three dimensions—Availability, Performance, and Quality—into one score that reveals how effectively your equipment converts planned production time into quality output.
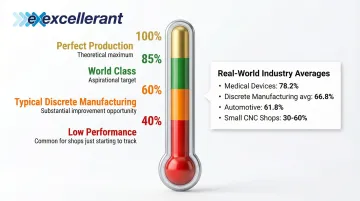
Standard OEE Benchmark Tiers:
- 100%: Perfect production (only good parts, maximum speed, zero stops)
- 85%: World Class for discrete manufacturers
- 60%: Typical for discrete manufacturing, indicating substantial improvement opportunity
- 40%: Low performance, common for facilities just starting to track
Industry Reality: While 85% represents the aspirational target, actual discrete manufacturing averages hover around 66.8%, with significant variation by sector. Medical devices average 78.2%, while automotive facilities average 61.8%. Small-to-medium CNC shops often operate between 30-60% before optimization.
What makes OEE particularly actionable is that a low score doesn't just confirm a problem—the three component scores tell you precisely where to look. Low Availability points to downtime. Low Performance points to speed loss. Low Quality points to defects and rework.
2. Production Efficiency
Production Efficiency measures actual output against standard (planned) output: Actual Output ÷ Standard Output × 100. This reveals whether your facility operates at planned capacity and where gaps occur—bottlenecks, slow changeovers, material delays, or unrealistic standards.
If your shop targets 200 parts per shift but consistently produces 150, your production efficiency is 75%. That 25% gap represents real lost capacity—hours your equipment ran without producing planned output. The key is ensuring your "standard output" reflects realistic historical performance, not theoretical maximums that no floor has ever sustained.
3. Machine Downtime Rate
Track both planned (scheduled maintenance) and unplanned (equipment failures) downtime separately—they require entirely different corrective actions. Planned downtime is predictable and manageable; unplanned downtime is the higher-cost emergency that destroys schedules.
Companion Metrics:
- Mean Time Between Failure (MTBF): How often failures occur
- Mean Time to Repair (MTTR): How quickly maintenance responds
Together, these metrics reveal both failure frequency and maintenance responsiveness, helping you determine whether you have an equipment reliability problem, a maintenance capacity problem, or both.
4. First Pass Yield (FPY)
FPY measures the percentage of units produced correctly the first time without rework or scrap: Good Units ÷ Total Units × 100. This is your quality-side performance indicator.
Benchmark Targets:
- 99%+: World-class target for high-performance operations
- 98%+: High-precision sectors (aerospace, medical devices)
- 95%+: Generally considered good
A low FPY signals process or equipment issues before they become customer-facing problems. It's your early warning system for quality degradation. Failure costs from rejects, rework, and complaints typically consume 5-15% of revenue—eliminating that waste directly improves margin.
5. On-Time Delivery (OTD)
OTD connects shop floor performance directly to customer satisfaction. Even high OEE scores can mask scheduling and throughput issues that result in missed delivery commitments.
Performance Levels:
- 95%: Standard benchmark for excellence
- 99%+: Best-in-class performance
Increasing customer retention by just 5% can boost profits by 25-95%, and 69% of consumers are less likely to shop with a retailer again if delivery misses the promised date by two days. OTD is where manufacturing performance meets business results.
How to Calculate Your Key Manufacturing Metrics
Calculating OEE Step by Step
OEE Formula: OEE = Availability % × Performance % × Quality %
Sub-Formulas:
- Availability = Run Time ÷ Planned Production Time
- Performance = (Ideal Cycle Time × Total Count) ÷ Run Time
- Quality = Good Units ÷ Total Units
CNC Machine Shop Example: Your CNC mill has 480 minutes of planned production time in a shift. The machine experiences 60 minutes of downtime (changeover, breakdowns), leaving 420 minutes of run time. Your ideal cycle time is 2 minutes per part. You produce 180 parts total, with 9 rejected for quality issues.
- Availability: 420 ÷ 480 = 87.5%
- Performance: (2 × 180) ÷ 420 = 360 ÷ 420 = 85.7%
- Quality: 171 ÷ 180 = 95%
- OEE: 87.5% × 85.7% × 95% = 71.2%

Most Common Calculation Mistake: Using total scheduled clock time — including breaks and planned meetings — instead of planned production time inflates OEE scores and masks real downtime losses. Planned production time is only the time you actually intended the machine to run.
Calculating Production Efficiency and Downtime
OEE tells you how efficiently a machine ran. Production efficiency shows you how the whole shift stacked up against your target output.
Production Efficiency Formula: Actual Output ÷ Standard Output × 100
Example: Your shop targets 200 parts per shift based on realistic historical performance. You produce 150 parts.
Production Efficiency: 150 ÷ 200 × 100 = 75%
That 25% gap is lost capacity. Now you can investigate: Were there material delays? Excessive changeovers? Equipment running slower than expected, or operator-related slowdowns?
Machine Downtime Rate: Track total downtime minutes as a percentage of available production time, separating planned from unplanned:
- Total Downtime Rate: Total Downtime Minutes ÷ Total Available Minutes × 100
- Unplanned Downtime Rate: Unplanned Downtime Minutes ÷ Total Available Minutes × 100
MTBF and MTTR:
- MTBF (Mean Time Between Failure): Total Operating Time ÷ Number of Failures
- MTTR (Mean Time to Repair): Total Repair Time ÷ Number of Repairs
A declining MTBF signals a reliability problem — your machines are failing more often. Rising MTTR means your team is taking longer to respond and recover, which compounds that downtime into a bigger production loss.
The Real Challenge: Getting Accurate Data From Your Machines
Why Manual Data Collection Fails
70% of manufacturers still collect data manually using clipboards, spreadsheets, and operator-reported logs. This approach consistently undermines KPI accuracy through predictable problems:
The Manual Data Problem:
- Manual data entry introduces a 1% error rate that compounds over time
- Reporting delays reach 24-30 hours, making real-time decision-making impossible
- Manual OEE calculations can overestimate performance by 10-30% compared to automated systems
- Missing context for why downtime occurred, not just that it occurred
- Rounding errors, incomplete data capture of short stops, and inconsistent definitions between operators
When your data arrives a day late with questionable accuracy, you're managing history, not production.
The Mixed Machine Fleet Reality
Most job shops run a combination of equipment: newer CNCs with digital outputs alongside older legacy machines with no native connectivity. The median age of CNC machine tools in U.S. job shops is 7 years, and 62% of shops still operate non-CNC lathes and milling machines.
This creates a painful choice: ignore legacy machines (creating blind spots in your data) or find a connectivity solution that handles any brand, any protocol, any age.
How IIoT-Based Machine Monitoring Solves This
Modern IIoT platforms collect real-time machine data automatically from every machine on the floor—regardless of make, model, or age—and feed it into a centralized platform where production status is visible the moment it changes.
Universal Connectivity Approach:
- Modern CNCs connect via standard ethernet or WiFi
- Legacy equipment integrates through serial communications or PLC intermediary devices
- Supported protocols include MTConnect, OPC UA, Fanuc Focas, HAAS MNET, and Mazak Mazatrol
Excellerant brings over 30 years of machine tool networking experience to this problem — roots that trace back to 1991, when the company's founders began connecting CNC machines before wireless was even an option. That history means the platform is built to handle any mix of new and legacy machines, eliminating manual data collection while delivering real-time production and downtime data across your entire fleet.
The Downstream Benefit for KPI Accuracy
When machines report their own status, cycle times, and fault codes in real time, OEE and downtime calculations become reliable enough to act on—not historical approximations reviewed days later when it's too late to fix the problem.
Automated data collection captures what manual methods miss: micro-stops, slow cycles, quality issues as they happen. A shift supervisor who used to review yesterday's OEE numbers at 8 a.m. can now see a spindle utilization drop at 2 p.m. and reassign work before the job falls behind schedule.
Building a Manufacturing Performance Dashboard
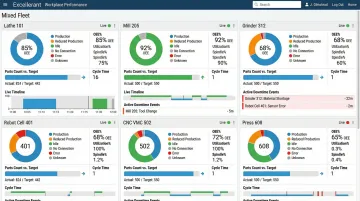
What an Effective Dashboard Must Display
Your shop floor dashboard should enable any supervisor or operator to understand the state of the floor in under 30 seconds:
Minimum Display Requirements:
- Live OEE per machine with color-coded status
- Current production count vs. target with progress indicators
- Active downtime events with duration and reason codes
- Daily and weekly trend lines showing performance trajectory
The goal is instant situational awareness: Which machines need attention right now? Are we on track to hit today's targets? Where are we losing the most time?
Role-Based Dashboards: One Size Doesn't Fit All
Different roles need different views:
Floor Supervisors:
- Real-time machine status and alerts
- Current job progress and completion estimates
- Active downtime events requiring immediate response
- Operator communication and issue reporting
Plant Managers:
- Shift-level summaries and performance comparisons
- Production bottleneck identification
- Resource utilization across the facility
- Trend analysis for continuous improvement initiatives
Executives:
- High-level performance metrics tied to business outcomes
- Cost impact analysis and ROI calculations
- Strategic capacity planning data
- Customer delivery performance and forecast accuracy
Each role makes different decisions on different timescales. Tailor the view accordingly — a floor supervisor needs to act in minutes, while an executive needs to spot trends across weeks.

Connecting Shop Floor Data to Front Office Systems
Manufacturers implementing comprehensive shop floor ERP visibility typically see 15-25% increases in OEE and 20-35% improvements in on-time delivery. When real-time machine data feeds into production schedules and job costing, shops can provide accurate delivery forecasts and catch capacity issues before they become customer problems.
Integration closes the gap between shop floor reality and what your business systems actually know. Without real-time machine data flowing into your ERP, the practical result is:
- Production schedules based on assumed — not actual — machine availability
- Job cost reports that miss unplanned downtime and scrap
- Delivery forecasts built on the last manual update, not current throughput
- Capacity decisions made hours or days after the relevant events occurred
The shops that get this right aren't just better informed — they're faster to respond when something goes wrong.
Turning KPI Data Into Real Performance Improvements
Establish Your Baseline First
Before chasing improvements, establish a reliable baseline for each KPI over a defined period—minimum 30 days of clean data. Shops often discover their actual OEE is significantly lower than assumed once real-time data replaces manual reporting. That "shock" is valuable: you can't improve what you can't measure accurately.
Use Downtime Data to Prioritize Improvements
Apply the Pareto principle: focus on the top 20% of downtime causes that consume 80% of total lost time. Real-time data reveals patterns that manual logs never would—frequent two-minute stops that individually seem trivial but collectively drain more capacity than a single one-hour breakdown.
A Pareto analysis of CNC lathe rejections showed that just two causes (poor finish and sharp edges) accounted for 75% of all rejections. Fix those two issues, and you've solved three-quarters of your quality problem.
Don't chase the most dramatic individual incidents—chase the categories that consume the most cumulative time.
The Continuous Improvement Cycle
Once you know where the losses are concentrated, run one focused improvement cycle at a time:
- Set a specific target for one KPI (e.g., increase OEE from 58% to 68% over 90 days)
- Identify root causes using collected data and downtime analysis
- Implement one change with clear ownership and a defined timeline
- Measure the result against your baseline
- Move to the next highest-impact opportunity and repeat
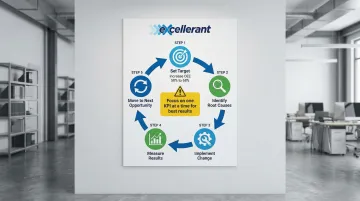
Caution: Don't try to improve all KPIs simultaneously. Diluted focus produces diluted results. Pick one metric, drive meaningful improvement, then move to the next.
Real-World Improvement Ranges
Case studies demonstrate what's possible with visibility and focus:
- Avalign Technologies achieved 25-30% OEE increases after deploying machine monitoring
- Siemens improved OEE from 65% to 85% on a gas turbine line through digital monitoring and predictive maintenance
- Many plants see immediate 10-15% OEE gains simply by gaining visibility into small stops and slow cycles
In each case, the gains came from acting on data that already existed on the shop floor—it just wasn't visible until monitoring made it measurable.
Frequently Asked Questions
How do you measure efficiency in manufacturing?
Manufacturing efficiency is typically measured using Production Efficiency (Actual Output ÷ Standard Output × 100) or Overall Equipment Effectiveness (OEE). OEE accounts for equipment availability, performance speed, and quality rate together — breaking efficiency into three components to pinpoint exactly where losses occur.
What are the 5 KPIs for manufacturing?
The five most widely tracked manufacturing KPIs are:
- Overall Equipment Effectiveness (OEE)
- Production Efficiency
- Machine Downtime Rate
- First Pass Yield
- On-Time Delivery
The right set depends on your facility's goals, but these five cover equipment performance, quality, and customer satisfaction.
What does 85% OEE mean?
85% OEE is considered "World Class" performance by industry standards, meaning the machine or facility is productive 85% of its planned operating time with minimal downtime, speed losses, and quality defects. Most shops average closer to 60%, making 85% an aspirational target that represents top-tier performance.
What is the difference between OEE and production efficiency?
Production efficiency compares actual output to planned output as a single percentage. OEE goes further — it breaks that gap into three specific causes (availability losses, performance losses, quality losses) so manufacturers know exactly where to focus improvement efforts, not just how much capacity they're losing.
How do I track manufacturing KPIs across machines with different brands and ages?
IIoT platforms that support multiple protocols can collect standardized data from any machine, making it possible to compare KPIs across the entire floor regardless of brand or age. Excellerant's platform connects everything from modern ethernet-based CNCs to decades-old serial-connected equipment.
What is a realistic OEE target for a machine shop?
While 85% is the world-class benchmark, most job shops and machine shops target 65-75% as an initial improvement goal. Real-time visibility alone often uncovers obvious losses — many shops see 10-15% OEE gains within the first few months of monitoring.