
Introduction
Every day, manufacturers lose thousands of dollars in production capacity without knowing exactly why. Machines sit idle between jobs, cycles slow imperceptibly over weeks, and quality defects accumulate — but the root causes remain buried in manual logs, operator guesswork, and fragmented spreadsheets. According to industry research, unplanned downtime alone costs U.S. manufacturers approximately $50 billion annually, yet 70% of manufacturers still rely on manual data collection methods like paper and clipboards that mask the true scale of the problem.
MES OEE software solves this visibility gap by connecting shop floor machines directly to real-time performance data systems. It transforms raw machine signals — running, idle, faulted, setting up — into structured performance data organized across the three pillars of manufacturing effectiveness: Availability, Performance, and Quality. Manufacturers gain a precise breakdown of exactly where capacity is being lost — and which corrective actions will have the most impact.
This article covers what MES OEE software is, how it works, the proven strategies manufacturers use to improve production performance, what to look for when choosing a solution, and the common mistakes that undermine OEE improvement efforts.
TLDR:
- MES OEE software connects machines to real-time data systems, measuring Availability, Performance, and Quality
- Automated data collection reveals losses manual tracking misses, often showing ±15% variance from operator logs
- Target the biggest loss category first using Pareto analysis rather than spreading effort across all issues
- Universal machine connectivity is critical: platforms must connect both legacy and modern equipment without blind spots
- Continuous monitoring drives compounding gains — OEE improvement is an ongoing practice, not a one-time fix
What Is MES OEE Software — And Why It Matters
Manufacturing Execution System (MES) is the software layer that sits between shop floor equipment and business-level systems like ERP. Gartner defines MES as "a specialist class of production-oriented software that manages, monitors and synchronizes the execution of real-time physical processes involved in transforming raw materials into intermediate and/or finished goods." It's responsible for orchestrating, recording, and analyzing what happens on the production floor in real time.
Overall Equipment Effectiveness (OEE) is the industry-standard metric for measuring productive manufacturing time. Originally defined by Seiichi Nakajima in 1984 as part of Total Productive Maintenance (TPM) methodology, OEE is calculated as the product of three ratios: Availability × Performance × Quality. A score of 100% represents perfect production with zero losses.
What "MES OEE Software" Means
MES OEE software combines these two capabilities into a single integrated platform. The MES layer collects and contextualizes machine data from CNCs, PLCs, and sensors across the shop floor. The OEE module uses that data to score equipment effectiveness and surface losses as measurable, comparable metrics that teams can act on.
Who Uses MES OEE Software
Different roles rely on MES OEE platforms for different purposes:
- Production managers need real-time visibility into line performance to identify bottlenecks and adjust schedules
- Plant engineers need downtime root-cause data to prioritize maintenance and process improvements
- Executives need reliable KPIs to guide capital investment and capacity planning decisions
- Operators need immediate feedback on cycle performance and quality to maintain standards
Each of these roles draws on the same underlying data stream — which is what makes a single integrated platform more effective than disconnected point solutions.
The Business Case
Federal Reserve data shows manufacturing capacity utilization typically hovers around 77%, meaning most facilities are running at roughly three-quarters of what their equipment could produce.
The OEE picture is sharper. World-class OEE is benchmarked at 85%, yet typical global manufacturing averages fall between 55% and 60%. That 25-30 point gap isn't abstract — it maps directly to hours of lost output, excess labor costs, and missed delivery windows that MES OEE software is built to quantify and close.
The Three Pillars of OEE: Availability, Performance, and Quality
OEE provides a structured view of production loss by breaking it into three distinct categories. Understanding how these pillars interact is essential to using MES OEE software effectively.
Availability: Downtime Losses
Availability measures the ratio of actual run time to planned production time. Losses here come from:
- Equipment failure — unplanned breakdowns, tooling failures, control errors
- Setup and adjustments — changeovers, material changes, program uploads
MES software captures these events automatically by monitoring machine states in real time. When a machine stops, the system records the exact duration and prompts operators to categorize the reason. Research shows equipment failure can account for 38.25% of total loss time, making it the single largest contributor to low OEE in many facilities.
Performance: Speed Losses
Performance measures the ratio of actual output speed to the theoretical maximum speed. Losses include:
- Minor stoppages — short stops under 2 minutes that are rarely recorded manually
- Reduced speed — running equipment slower than design capacity due to worn tooling, operator pacing, or process adjustments
These losses are difficult to detect without automated data collection. One study found reduced speed accounted for 28.48% of loading time, representing a massive hidden drain on capacity that manual logs miss entirely.
Quality: Defect Losses
Quality measures the ratio of good parts produced to total parts started. Losses include:
- Startup rejects — scrap produced during setup or process stabilization
- Production rejects — defects during steady-state production requiring rework or scrap
MES OEE software flags quality-linked downtime events and connects reject data to specific machines, shifts, or jobs, enabling root-cause analysis that manual tracking cannot provide.
How the Three Pillars Interact
A facility can have high Availability (machine is running most of the time) but low Performance (machine is running slowly), masking significant hidden losses. The Six Big Losses framework gives that complete picture — mapping every production loss back to the pillar it belongs to.
The Six Big Losses Framework
MES OEE software uses the Six Big Losses framework from TPM to categorize every production loss into one of the three OEE pillars:
| Loss Category | OEE Pillar | Examples |
|---|---|---|
| Equipment Failure | Availability | Unplanned breakdowns |
| Setup & Adjustments | Availability | Changeovers, program uploads |
| Idling & Minor Stops | Performance | Stops under 2 minutes |
| Reduced Speed | Performance | Running below design rate |
| Startup Rejects | Quality | Scrap during process stabilization |
| Production Rejects | Quality | In-cycle defects and rework |
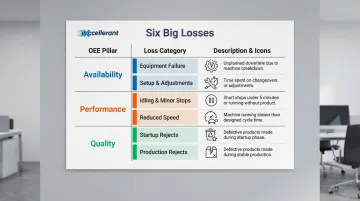
When every loss has a category, improvement teams stop debating where to look — and start fixing the right problem.
How MES Software Powers Real-Time OEE Tracking
The Data Collection Layer
MES OEE software connects directly to machine controls — CNCs, PLCs, sensors — to capture real-time status signals without requiring manual operator input. Supported protocols include:
- MTConnect — open standard for machine tool data exchange
- OPC UA — universal automation protocol for industrial communication
- Fanuc Focas — native protocol for Fanuc CNC controllers
- HAAS MNET — Haas machine networking protocol
- Mazak Mazatrol — Mazak proprietary CNC communication
This machine-level connectivity is what makes OEE data accurate and continuous rather than retrospective and estimated. Automated dashboards can reveal a variance of ±15% compared to manual logs, highlighting the inaccuracy of human data entry.
Contextualizing Raw Machine Signals
A machine state of "stopped" becomes a categorized downtime event when operators confirm the reason through a connected tablet or HMI. For example:
- Machine signal: Idle
- Operator input: Tool change
- Result: Categorized as Setup & Adjustment loss (Availability)
That structured data is what feeds the dashboards and alerts teams use to respond in real time.
Real-Time Dashboards and Alerts
MES OEE platforms display live scores by machine, cell, shift, or plant. When OEE drops below a defined threshold, the system fires an alert — giving supervisors a window to intervene before a brief slowdown compounds into significant lost production time.
Excellerant's platform connects to any machine brand or protocol — including legacy CNC equipment — so manufacturers gain OEE visibility across the full shop floor without replacing older machines.
Proven Impact of Real-Time Monitoring
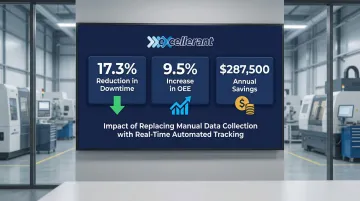
An aerospace component manufacturer that implemented automated monitoring reported:
- 17.3% reduction in downtime
- 9.5% increase in OEE
- $287,500 in annual savings
These results came from replacing manual data collection with real-time automated tracking that captured losses operators couldn't see or didn't record.
Key Strategies to Improve Production Performance with MES OEE Software
Strategy 1: Establish an OEE Baseline Before Making Changes
The first step is running MES OEE software for 2-4 weeks without intervening, documenting true performance. Without a baseline, improvement efforts cannot be measured or prioritized effectively. During this period:
- Let the system capture all machine states and downtime events
- Allow operators to learn the categorization interface
- Validate cycle times against 30-50 cycles per operation
- Compare automated data to manual logs to identify discrepancies
That documented baseline tells you exactly where you're starting — and where to focus first.
Strategy 2: Target the Biggest Loss Category First Using Pareto Analysis
Once you have a baseline, resist the urge to fix everything at once. MES OEE platforms rank downtime reasons by frequency and duration — use that to apply the 80/20 rule:
- Identify the top 3 downtime codes driving the most loss
- Focus engineering resources on the single category with the greatest impact
- Don't spread effort across all issues simultaneously
For example, if equipment failure accounts for 40% of downtime, addressing that one category will yield far greater returns than tackling ten smaller issues.
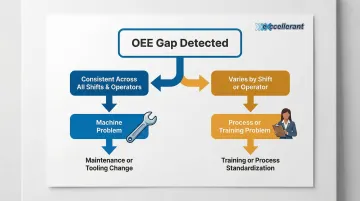
Strategy 3: Use Shift and Operator Performance Data to Identify Variability
MES OEE software captures performance not just by machine but by shift and operator. This reveals whether an OEE gap is:
- A machine problem — consistent low performance across all shifts and operators
- A process/training problem — performance varies significantly by shift or operator
This distinction completely changes the corrective action required. Machine problems need maintenance or tooling changes; operator variability needs training or process standardization.
Strategy 4: Integrate OEE Data with Production Scheduling
Feed real-time OEE data back into scheduling decisions so production planners account for actual machine capacity — not theoretical capacity — when committing to delivery dates. This:
- Reduces the risk of late orders caused by overestimating available runtime
- Enables dynamic scheduling based on current machine performance
- Improves on-time delivery rates
Excellerant's machine monitoring software feeds live shop floor data directly to connected business systems, so schedulers are always working from current machine performance — not last week's numbers.
Strategy 5: Set Incremental OEE Improvement Targets Tied to Specific Loss Categories
World-class OEE targets around 85% aren't reached overnight. Build toward them incrementally:
- Set targeted micro-improvements (e.g., reduce changeover downtime by 15% in 90 days)
- Focus on one loss category at a time
- Measure progress weekly
- Compound small gains over time into significant overall OEE improvements
This incremental approach maintains momentum and delivers measurable ROI at each stage.
What to Look for in MES OEE Software
Universal Machine Connectivity
The most critical selection criterion is whether the MES OEE software can connect to every machine in the facility — not just modern equipment with standard protocols, but also older CNCs and legacy machines. A system that leaves even a fraction of machines unmonitored creates blind spots that undermine overall OEE accuracy.
Excellerant's platform is designed specifically to handle any machine brand, any protocol, new or legacy. Their system supports modern ethernet and WiFi connections for newer equipment, and serial communications or PLC adapters for older machines, making it particularly well-suited for mixed-environment shops.
Ease of Deployment and Scalability
Evaluate these factors:
- Does it require dedicated servers, or is it cloud-based?
- How long does deployment take from purchase to live production data?
- Can it scale from a handful of machines to a full plant without rearchitecting?
- Do licensing costs scale linearly, or are there flat-rate options?
Excellerant's platform requires only a single server installation with zero client software installations (browser-based access). Their unlimited client access model with no additional licensing fees is worth comparing against per-seat pricing models when evaluating other vendors.
Reporting, Integration, and Support Quality
OEE data only drives decisions if it's presented clearly and flows into the tools managers already use. Ask vendors about:
- Whether out-of-the-box reporting includes Pareto charts, trend analysis, and shift comparisons
- Bidirectional ERP data flow with SAP, Oracle, or other existing systems
- Where technical support is based — US-based teams generally resolve issues faster due to time zone alignment and direct communication
Excellerant's US-based support team and Open API architecture address both of these directly — connecting to major ERP platforms without custom middleware.
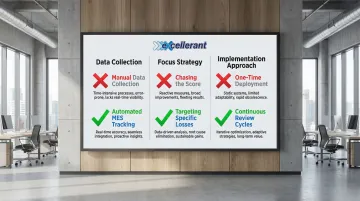
Common OEE Mistakes Manufacturers Make
Relying on Manual or Operator-Reported OEE Data
When operators enter their own downtime reasons and cycle counts on paper or in spreadsheets, OEE numbers are routinely inflated or incomplete. Manual data collection is widely considered "the biggest problem" for accurate performance measurement because it:
- Misses minor stoppages under 2 minutes
- Rounds up cycle times
- Introduces subjective categorization
- Creates latency where issues are identified hours after occurrence
Automated MES data collection eliminates this bias and captures the complete picture.
Chasing a High OEE Number Without Fixing the Right Losses
Some facilities optimize for the OEE score itself rather than the underlying losses. For example:
- Running a machine through a longer shift to boost Availability
- Ignoring a recurring quality defect that inflates scrap costs
- Relaxing quality thresholds to improve the Quality metric
MES OEE software should drive targeted loss reduction — not serve as a scoreboard. OEE benchmarks vary by industry and product mix — a high score on a narrow product range tells you far less than a moderate score improving month over month.
Treating OEE as a One-Time Project Rather Than a Continuous Practice
Facilities that deploy MES OEE software but stop reviewing data after the initial implementation fail to capture the compounding gains that come from:
- Ongoing monitoring of new loss patterns
- Trend analysis over months and years
- Iterative process adjustments based on fresh data
OEE is a continuous improvement metric — the compounding gains come from regular review cycles, not the go-live date. Teams that schedule monthly loss reviews and act on trend data consistently outperform those that treat deployment as the finish line.
Frequently Asked Questions
What is MES and OEE?
MES (Manufacturing Execution System) is software that manages and monitors production operations in real time, while OEE (Overall Equipment Effectiveness) is the metric MES uses to measure how efficiently equipment is being utilized — calculated from Availability, Performance, and Quality.
What is the best MES and OEE software?
The best MES OEE software depends on facility size, machine mix, and integration needs. Key factors include universal machine connectivity (especially for legacy equipment), real-time data accuracy, ease of deployment, and depth of manufacturing domain expertise — particularly for shops running a mix of newer and older CNC machines.
What is a good OEE score in manufacturing?
World-class OEE benchmarks at 85%, though most manufacturers start between 55–60%. The more important goal is continuous improvement from a facility's own baseline rather than immediately chasing an industry benchmark.
What are the three components of OEE?
OEE is the product of three factors: Availability (actual run time vs. planned time), Performance (actual speed vs. ideal speed), and Quality (good parts vs. total parts produced). Each component targets a distinct category of production loss.
How does MES software collect OEE data from machines?
MES software connects directly to machine controllers — CNCs and PLCs — via standard protocols or hardware adapters. Those connections capture real-time status signals, which the system categorizes into OEE loss events and displays on live dashboards with no manual data entry required.
Can MES OEE software connect to legacy CNC machines?
Yes. Modern MES OEE platforms built for mixed-machine environments can connect to older CNC equipment alongside newer machines through serial communications or PLC adapters. The specific protocols and hardware required vary by vendor and machine vintage, so it's worth confirming compatibility during evaluation.