
Introduction
OEE (Overall Equipment Effectiveness) is the go-to metric for measuring how productively manufacturing equipment is actually being used — not just whether it's running, but whether it's running at the right speed, producing good parts, and staying available when scheduled.
Job shop managers using JobBoss often want to track OEE as part of production reporting. The formula itself is straightforward: Availability × Performance × Quality. The challenge is that JobBoss doesn't calculate OEE automatically — it captures the underlying data, but pulling accurate numbers requires knowing exactly which records to use and where manual steps are unavoidable.
This guide walks through exactly how to calculate OEE using JobBoss data. Here's what it covers:
- What data to gather before you start
- A step-by-step calculation walkthrough
- Variables that can make or break result accuracy
Key Takeaways
- OEE = Availability × Performance × Quality — none of the three are calculated automatically in JobBoss
- Availability is Run Time ÷ Planned Production Time, pulled from Job Tracking or Shop Floor Activity records
- Performance depends on job-specific Ideal Cycle Times in your Routing or Estimating records, a setup step many job shops skip
- Quality pulls from work order scrap/rework records — accurate operator logging is essential
- Data quality is the biggest limiting factor; unreliable entries produce unreliable OEE scores
What OEE Measures in a Job Shop Environment
OEE represents the percentage of planned production time that is genuinely productive. According to OEE.com, 85% is often cited as world-class, while most manufacturers operate closer to 60% — and scores below 40% are not uncommon in struggling operations.
For job shops, OEE is both harder to compute and more valuable when done correctly. Unlike high-volume production lines running a single part type, job shops run dozens of different parts on the same machine.
That variability creates a specific problem: the Ideal Cycle Time component of Performance changes with every job. CIRP Annals peer-reviewed research identifies this as one of the core implementation challenges for high-mix/low-volume environments — which is exactly what most job shops are.
The Three OEE Factors
Each factor exposes a different category of production loss:
- Availability — reveals downtime losses (breakdowns, material delays, unplanned stoppages)
- Performance — reveals speed losses (machine running slower than ideal, micro-stops)
- Quality — surfaces defect and rework losses (scrapped or rejected parts)
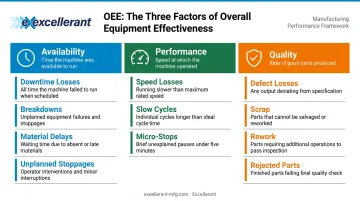
Understanding which factor is dragging your OEE down tells you where to focus — and for most job shops, Performance is the hardest one to get right.
What You Need Before Calculating OEE in JobBoss
Don't start pulling numbers until these three conditions are met:
Required JobBoss modules and records:
- Shop Floor Control — job tracking and operator time logs
- Work Order/Routing records — planned production time and ideal cycle times per operation
- Scrap/Rework records — quality data by job
Ideal Cycle Time: The Most Common Gap
Each job's Ideal Cycle Time (the fastest time to produce one good part under ideal conditions) must be established per operation in the JobBoss Routing or Estimating module. If that value isn't set correctly, your Performance score is meaningless from the start.
Three common ways this goes wrong:
- Value is missing entirely from the Routing or Estimating record
- Rate is averaged across multiple jobs instead of set per operation
- Historical actuals are used instead of true machine-ideal rates
OEE.com's FAQ explicitly distinguishes standard or budget cycle time from Ideal Cycle Time and warns against using the wrong baseline.
Operator Data Discipline
Even with Ideal Cycle Times set correctly, your OEE data is only as good as what operators record. They must consistently log:
- Actual start and stop times per operation
- Downtime reason codes (not just that downtime occurred)
- Scrap quantities before job close
Gaps in any of these three habits skew all OEE components. A machine that sat idle for 30 minutes before an operator logged the stoppage will show that time as run time — logging that idle time as run time and inflating your Availability score.
How to Calculate OEE in JobBoss: Step-by-Step
Step 1: Pull Planned Production Time
Navigate to the relevant Work Order or Routing record. Planned Production Time is the scheduled time for each operation.
Critical distinction: Planned Production Time excludes planned breaks, shift changes, and scheduled maintenance. For example, OEE.com's standard approach starts with an 8-hour shift (480 minutes), subtracts 60 minutes of breaks, and uses 420 minutes as Planned Production Time.
Confirm your JobBoss work orders are set up to reflect only scheduled production time — not total shift time.
Step 2: Calculate Availability
From Job Tracking or Shop Floor Activity records, locate the actual Run Time — the time the machine was actively running after subtracting unplanned downtime events.
Formula: Run Time ÷ Planned Production Time = Availability %
Example: 200 minutes run time ÷ 240 minutes planned = 83.3% Availability
Note: Changeover time should be included in Availability per OEE standards — not excluded as planned downtime.
Step 3: Calculate Performance
Locate two values from the Routing/Estimating record and SFDC log:
- Ideal Cycle Time for the specific operation
- Total Parts Produced (actual output)
Formula: (Ideal Cycle Time × Total Parts Produced) ÷ Run Time = Performance %
Example: (0.5 min/part × 160 parts) ÷ 200 minutes = 40% Performance
Performance drops below 100% due to:
- Machine running slower than the ideal cycle time
- Micro-stops interrupting the production run
- Speed losses during operation
Job shop complexity: If multiple jobs ran on the same machine in a shift, Performance must be calculated as a weighted average by job duration — each job has its own Ideal Cycle Time. You'll need a spreadsheet for this calculation.
Step 4: Calculate Quality
Access the scrap and rework records for the job. Good Count = Total Parts Produced minus scrapped and reworked units.
Formula: Good Count ÷ Total Count = Quality %
Example: 152 good parts ÷ 160 total parts = 95% Quality
Step 5: Multiply for the Final OEE Score
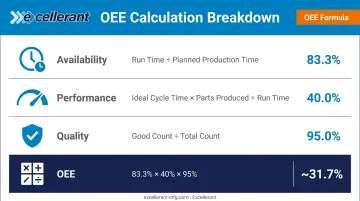
OEE = Availability % × Performance % × Quality %
Using the examples above: 83.3% × 40% × 95% = ~31.7% OEE
The multiplicative structure means even individually acceptable scores can mask significant losses. A shop running at 83% Availability, 85% Performance, and 90% Quality still lands at ~63% OEE — squarely in the "typical manufacturer" range. World-class OEE is generally 85% or above, which requires all three components performing well simultaneously.
When a score falls short, the component with the largest gap points to where to focus first: chronic downtime issues hit Availability, slow cycles or micro-stops drag Performance, and scrap or rework erodes Quality.
OEE Component Summary
| Component | Formula | Example Values | Result |
|---|---|---|---|
| Availability | Run Time ÷ Planned Production Time | 200 min ÷ 240 min | 83.3% |
| Performance | (Ideal Cycle Time × Parts Produced) ÷ Run Time | (0.5 × 160) ÷ 200 | 40.0% |
| Quality | Good Count ÷ Total Count | 152 ÷ 160 | 95.0% |
| OEE | Availability × Performance × Quality | 83.3% × 40% × 95% | ~31.7% |
Key Variables That Affect OEE Accuracy in JobBoss
OEE results are only as reliable as the inputs feeding the calculation. Four variables consistently determine whether the output is actionable or misleading.
Ideal Cycle Time Accuracy
If the Ideal Cycle Time stored in JobBoss Routing records reflects historical averages rather than true machine-ideal rates, Performance will be systematically overstated. An Ideal Cycle Time that is 15% too slow makes Performance appear artificially high — hiding real speed losses without revealing them.
To audit: compare your stored cycle times against machine capability data from setup sheets or proven run records. Update values to reflect what the machine can actually achieve under ideal conditions, not what operators typically deliver.
Planned Production Time Definition
Whether scheduled breaks and planned maintenance are included in Planned Production Time directly changes your Availability denominator. Including planned downtime artificially depresses Availability, making the shop appear less efficient than it is.
More critically, inconsistent definitions across work centers or shifts make cross-machine OEE comparisons meaningless.
Operator Data Entry Consistency
Manual data entry in JobBoss creates gaps that skew all three OEE components. Disciplined SFDC data entry in JobBoss requires:
- Logging start time at the machine, when the job begins — not estimated later
- Entering downtime reason codes immediately when stoppages occur
- Recording scrap and rework counts before closing the job, not after the fact
Poor discipline consistently overstates Availability and understates Quality.
Multi-Job Shift Complexity
When a single machine runs two or three jobs in one shift, each with different ideal cycle times, OEE must be calculated per job segment.
A blended shift OEE weights Performance incorrectly. Faster jobs absorb the numbers from slower ones, and the combined figure masks where the real losses are occurring.
Common Mistakes When Calculating OEE in JobBoss
These four data entry and configuration errors account for most inaccurate OEE scores in JobBoss:
- Planned Production Time: Using total machine time — including planned breaks — in the denominator lowers Availability and misrepresents actual downtime losses
- Ideal Cycle Time: Applying one rate across all jobs on a machine produces Performance scores that swing without reflecting real machine health; each routing needs its own ideal rate
- Scrap vs. rework: Lumping both into a single number hides root causes — JobBoss supports separate codes, so track them independently to distinguish outright failures from correctable defects
- Calculation frequency: Running OEE from monthly aggregated reports masks short-term fluctuations; calculate per job or per shift to tie specific events to score changes
When Manual OEE Tracking in JobBoss Isn't Enough
The core limitation of calculating OEE in JobBoss is structural: the process relies entirely on operator-entered data and manual spreadsheet calculations. Results are retrospective, labor-intensive, and dependent on consistent human discipline across every shift.
Shops wanting real-time OEE visibility need a dedicated machine monitoring layer — one that captures what JobBoss can't: live machine state, actual cycle counts, and downtime reasons without operator input.
Deloitte's 2025 smart manufacturing survey reports up to 20% improvement in production output and employee productivity from smart manufacturing adoption, with 27% of manufacturing leaders ranking IIoT as a top investment priority for the next two years.
Excellerant's machine monitoring platform is built for job shops and CNC environments. It connects any machine — modern or legacy, across all major protocols (MTConnect, Fanuc FOCAS, HAAS MNET, Mazak Mazatrol, RS-232, PLC adaptors) — and automatically captures run time, downtime, and cycle counts without operator entry.
Key capabilities relevant to OEE:
- Real-time Availability tracking — automated downtime recording captures every machine stoppage; operators use a one-tap interface to categorize reasons (personnel, material, tooling, machine fault)
- Automatic cycle count and run-time capture — eliminates the manual SFDC logging that creates gaps in JobBoss records
- Native OEE calculation — the platform continuously computes Availability, Performance, and Quality with granular breakdowns by machine, shift, and job
- Bi-directional JobBoss integration — real-time machine data pushes directly into JobBoss; job and work-order data pulls back to the shop floor, replacing manual labor tickets with automated actual-hours capture
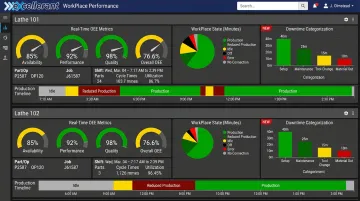
Shops gain accurate OEE inputs without spreadsheet overhead — and a reliable historical record that makes job-over-job and week-over-week performance trends visible at a glance.
Frequently Asked Questions
What is the formula to calculate OEE?
OEE = Availability × Performance × Quality. Availability is Run Time ÷ Planned Production Time, Performance is (Ideal Cycle Time × Parts Produced) ÷ Run Time, and Quality is Good Count ÷ Total Count. Each factor is expressed as a percentage between 0–100%.
What is OEE on a job?
OEE on a job measures equipment effectiveness for a specific work order or part run, rather than across a full shift. For job shops, this job-level view matters most — multiple different parts run on the same machine, and each has its own Ideal Cycle Time.
Does JobBoss automatically calculate OEE?
No. JobBoss does not natively calculate OEE as an automated metric. It captures the underlying data — run time, parts produced, scrap records — that users must extract and calculate manually or via spreadsheet.
What is a good OEE score for a job shop?
Industry benchmarks classify 85% as world-class, 60% as typical, and below 40% as low. Job shops generally score lower than high-volume manufacturers due to frequent changeovers and varying ideal cycle times per job. No universal benchmark fits every operation, so treat these figures as directional targets rather than hard pass/fail thresholds.
What is the difference between planned and unplanned downtime in OEE?
Planned downtime (scheduled breaks, maintenance windows) is excluded from Planned Production Time in the OEE calculation. Unplanned downtime (breakdowns, material shortages) reduces Run Time and directly lowers the Availability score.
How often should OEE be calculated in JobBoss?
Per job or per shift — not monthly. Frequent calculation makes it possible to correlate specific events (machine issues, operator changes, new tooling) with score changes — turning raw scores into actionable fixes.