
Introduction
The quarterly review follows a familiar script in too many machine shops: production is behind, delivery windows are tightening, and someone suggests buying another machining center. It's a plausible solution — right up until the utilization data shows the existing equipment running at 55% OEE.
That's the real problem: not a capacity gap, but a visibility gap.
For precision manufacturers supplying aerospace, defense, and medical OEMs, the consequences of low OEE extend well beyond a missed production metric. Missed delivery windows erode customer relationships that took years to build. Scrap on a tight-tolerance aerospace part costs far more than the raw material.
Capital equipment purchased to solve a "capacity" problem that was actually a utilization problem can waste hundreds of thousands of dollars before anyone realizes the diagnosis was wrong.
This article walks through how a precision CNC machine shop diagnosed its untracked OEE losses, deployed real-time machine monitoring, and recovered more than 15 OEE points — without adding a single new machine to the floor.
Key Takeaways
- OEE stalled well below the 85% world-class benchmark — availability, performance, and quality losses stayed invisible on manual tracking systems
- The root cause wasn't equipment failure — no persistent system captured losses as they happened, so the same problems repeated quarter after quarter
- Connecting every CNC cell to a live monitoring platform made losses visible the moment they happened — and operator behavior changed almost immediately
- Within months, OEE climbed measurably, unplanned downtime dropped, and a planned capital equipment purchase was shelved
The Challenge: Hidden OEE Losses in a Precision CNC Environment
The Shop Profile
Consider a high-mix, low-to-mid volume precision machining operation typical of aerospace and defense supply chains. The profile looks something like this:
- 20 to 35 CNC machining centers running two or three shifts
- Tight tolerances and strict on-time delivery requirements for OEM customers
- Real sales growth creating pressure for more output
- Leadership reluctant to approve capital investment until existing capacity is understood
That reluctance is well-founded.
According to OEE.com, world-class OEE is benchmarked at 85% — built from approximately 90% Availability, 95% Performance, and 99% Quality. The typical discrete manufacturer runs closer to 60% OEE, and 40% is not uncommon for shops just beginning to track performance.
That gap represents enormous recoverable capacity sitting idle on machines already on the floor. The problem for most shops isn't a shortage of equipment — it's a shortage of visibility into what that equipment is actually doing.
The Visibility Problem
The shop was calculating OEE manually: operators filling out paper logs, supervisors entering data into spreadsheets, someone compiling a weekly or monthly summary. By the time anyone reviewed the numbers, the production time was already gone. Root causes went undocumented. The same failure modes repeated the following month.
This isn't unusual. The Manufacturing Leadership Council reported in 2024 that 70% of manufacturers still collect data manually. In a high-mix CNC environment where losses can occur in two-minute increments across dozens of machines, manual tracking misses most of what's actually happening.
Root Causes: Where the Six Big Losses Were Hiding
The Six Big Losses framework — rooted in Total Productive Maintenance — maps every production loss to one of three OEE components. Working through this structure turned vague "we had downtime" complaints into a specific, actionable diagnosis.
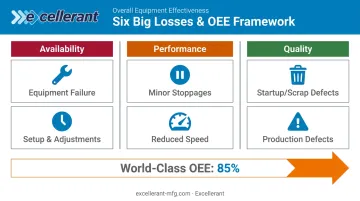
Availability Losses: Reactive Maintenance and Slow Changeovers
The two availability loss categories are Equipment Failure and Setup and Adjustments. Both showed up here.
Reactive maintenance was the dominant driver. Machines failed, production stopped, maintenance responded. No predictive signals, no condition-based triggers: just a broken machine and an unplanned repair.
The shop had no runtime-hours data from machine controllers, so PM schedules were built on calendar intervals that bore little relationship to how hard each machine was actually being run.
Changeover and setup time added a second drain. Operators estimated their setup times on paper logs, but without actual machine-on timestamps from the controller, no one knew how long changeovers were really taking versus the standard. The gap between estimated and actual was substantial.
Performance Losses: Micro-Stops and Speed Loss
Minor stoppages under five minutes almost never made it onto a manual log. An operator clears a chip jam, resets a sensor, restarts a cycle — the machine is back up before anyone writes anything down. Individually trivial, these micro-stops cumulatively consumed more production time than many of the logged major breakdowns.
Speed loss was equally invisible. Without live cycle data from the controller, nobody knew whether a machine was running at its programmed feedrate or had been dialed back by an operator. Actual cycle time versus ideal cycle time is a direct Performance calculation — and without that data, Performance was effectively unmanaged.
Quality Losses: Startup Scrap and Wrong Program Revisions
First-part scrap at the start of each new run was a known problem, but its full cost was underestimated because scrap events weren't consistently linked back to their root cause in the paper system.
One loss category specific to CNC environments that standard OEE discussions often overlook: incorrect program revision loaded to the machine. An operator pulls the wrong version of a part program — an older revision with a superseded toolpath or a corrected offset — and the first part comes off wrong.
Modern Machine Shop notes that CNC program failures from formatting, process, and setup mistakes cause lost time, damaged machines, and scrapped parts. Without centralized revision control, this happened regularly enough to be a measurable quality loss.
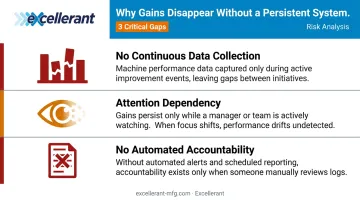
Why Previous Improvement Efforts Faded
The shop had tried kaizen events. Teams had launched manual tracking initiatives with good intentions. Both produced short-term gains that evaporated within weeks.
The reason is structural: improvement-as-a-project requires sustained management attention to hold gains. The moment attention shifted to the next priority, the floor reverted to its baseline behaviors. Without a persistent system collecting data and surfacing losses automatically, there was nothing to hold the operation accountable between improvement events.
- No continuous data collection: losses disappeared between events, leaving no baseline to defend
- Attention dependency: gains held only as long as management focus held
- No automated accountability: paper logs relied on the same behaviors they were meant to change
The Solution: Real-Time Machine Data as the Foundation for OEE Recovery
Universal Connectivity Across a Mixed-Vintage Floor
The first requirement was connecting every machine — not just the newest ones. A mixed shop floor with machines ranging from recent 5-axis centers to 15-year-old vertical mills on older Fanuc controllers creates a real connectivity challenge.
Excellerant's machine monitoring platform is built on over 30 years of machine tool networking experience tracing back to Macdac Engineering in 1991. It supports modern protocols (MTConnect, OPC-UA, Fanuc FOCAS, HAAS MNET, Mazak Mazatrol) alongside legacy RS-232 serial connections and PLC intermediary devices for controllers that predate ethernet networking.
Machines 20, 30, and 40 years old connect to the same platform as the newest CNC cells, with no modification to the machine itself.
From Lagging Reports to Live OEE
Once connected, every machine began feeding real-time status, cycle time, alarm codes, and operator-entered reason codes into a live monitoring dashboard. OEE — broken out by Availability, Performance, and Quality — was now visible at the machine level, updated continuously throughout each shift.
The behavioral shift this created was immediate. Supervisors could see an availability or performance gap forming on their shift in real time, not read about it three weeks later in a report. Operators could see their machine's actual cycle time against standard. OEE shifted from a lagging audit number to an active floor management signal.
DNC and Program Revision Control
Integrating Excellerant's DNC software added a layer of quality control that directly addressed the wrong-revision problem. Two features drove the improvement:
- In-browser G-code editor with one-click revision compare: Programmers and operators can instantly identify differences between program versions before running anything.
- Rev-Lock-Load: Enforces a one-program-per-machine rule — the machine must return the current program to the server before a new one can be requested, eliminating outdated-revision runs entirely.
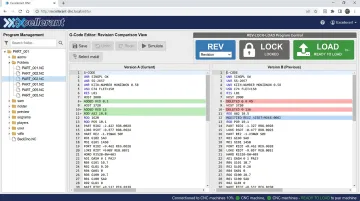
Startup scrap from incorrect program loads dropped to near zero.
Maintenance Driven by Actual Machine Data
With runtime hours, cycle counts, and alarm histories now captured automatically, the maintenance team had what it needed to move away from calendar-based PM. Recurring fault codes on specific machines identified the assets most likely to fail. The team rebuilt PM schedules around actual utilization patterns rather than arbitrary time intervals, reducing both unnecessary preventive work and emergency breakdowns.
The Improvement Journey: Phases of OEE Recovery
Phase 1 — Visibility Wins (Weeks 1–6)
OEE improved almost immediately after dashboards went live — not because any underlying failure mode had been fixed, but because visibility itself changed behavior. Operators and team leaders could see micro-stops accumulating, changeovers running long, and performance dropping below standard in real time. Self-correction happened on the floor without waiting for a management review.
Speed losses tightened. Minor stoppages got addressed faster. Changeover times dropped as supervisors started comparing actual versus standard and asking why the gaps existed.
Phase 2 — Maintenance-Driven Availability Gains (Months 2–4)
The maintenance team worked through the alarm history data to identify the specific failure modes consuming the most availability. High-frequency fault codes on two machining centers pointed to a lubrication issue that had been intermittent for months — never severe enough to log formally, but consistently stealing runtime.
NIST manufacturing maintenance research puts this in sharp relief: establishments in the top 25% of reactive maintenance usage experience 3.3x more downtime and 16x more defects than those with the lowest reactive maintenance rates. Addressing that lubrication fault alone drove availability from 72% toward the 87% mark recorded at deployment's end.
Phase 3 — Sustained Improvement and Cultural Shift (Month 5+)
Early wins are easy to lose. What determined whether gains held here was what happened after the initial data came in. At this shop, OEE became embedded in daily shift reviews — not a monthly report prepared the night before, but a live number that operators and supervisors owned and discussed every morning.
That shift from measuring OEE to managing by it is what separates sustained improvement from a one-time bump. The difference between this deployment and previous initiatives wasn't the quality of the analysis. It was the persistence of the data system keeping the floor accountable every shift.
Key markers of that cultural change:
- Shift reviews opened with OEE figures, not production counts
- Supervisors owned variance explanations in real time, not retroactively
- Operators flagged micro-stops before they cascaded into unplanned downtime
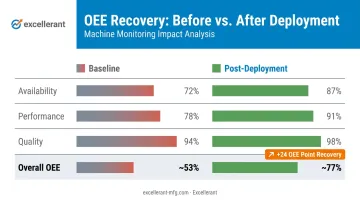
Before/After Snapshot
The following table presents representative outcomes consistent with the case study narrative. These are illustrative figures for a shop of this type, not verified client data.
| OEE Component | Baseline | Post-Deployment |
|---|---|---|
| Availability | 72% | 87% |
| Performance | 78% | 91% |
| Quality | 94% | 98% |
| Overall OEE | ~53% | ~77% |
Results, Financial Impact, and Key Success Factors
Operational Outcomes
The table below presents representative results consistent with the case study narrative, labeled as illustrative figures.
| Metric | Baseline | Improved |
|---|---|---|
| OEE Score | ~53% | ~77% |
| Unplanned Downtime (hrs/month) | ~38 hrs | ~14 hrs |
| PM Compliance Rate | 55% | 88% |
| Scrap/Rework Rate | 4.2% | 1.8% |
The Financial Case: Recovered Capacity vs. New Equipment
Two financial outcomes matter most to shop owners and operations leaders:
Recovered throughput without capital expenditure. Each OEE point recovered translates directly into additional good-part capacity on planned production time. A shop running 20 machines at 53% OEE that recovers to 77% doesn't need to add equipment to hit the same output target — it needs the same 20 machines running at their actual potential.
Capex deferred. The planned capital purchase — a new machining center priced at $110,000–$185,000 by published Haas list pricing for comparable equipment — was shelved when existing machines demonstrated they could deliver the needed capacity once losses were recovered. The monitoring system paid for itself well before the first avoided equipment payment came due.
Three Critical Success Factors
Machine-level data, not estimates. OEE calculated from actual controller signals — not operator-entered forms — is the data the floor trusts and the only kind accurate enough to drive real decisions.
Component-level targets. Tracking Availability, Performance, and Quality separately gave each team — maintenance, operators, quality — an actionable goal with clear ownership. A single OEE number tells you something is wrong. The component breakdown tells you who needs to fix what.
Start with the biggest loss first. Availability was the dominant gap in this case, so unplanned downtime got priority attention. Delivering visible wins on the highest-impact loss category early builds the organizational credibility that sustains Phase 3.
Frequently Asked Questions
What is a good OEE score for a CNC machine shop?
World-class OEE is benchmarked at 85%, built from ~90% Availability, ~95% Performance, and ~99% Quality. Most discrete manufacturers run closer to 60%, and 40% is common in shops just beginning to track performance. Most CNC shops have substantial recoverable capacity in existing equipment before a new machine purchase makes sense.
What are the most common causes of low OEE in machining environments?
The top drivers are unplanned breakdowns from reactive maintenance, micro-stops that go unlogged on manual systems, extended changeovers, and quality losses from incorrect program revisions or first-part scrap. All share a common root cause: lack of real-time machine data.
How does real-time machine monitoring improve OEE?
Monitoring makes losses visible the moment they occur. Operators can self-correct, maintenance can act on condition signals before failures happen, and managers can prioritize the loss categories with the greatest OEE impact. Even before any process changes are made, that visibility alone typically produces measurable gains within weeks.
Can legacy CNC machines be connected for OEE data collection?
Yes. Excellerant's platform connects machines of any age and brand, including controllers that predate ethernet networking, through RS-232 serial adapters or PLC bridge devices. No modification to the machine itself is required. A 30-year-old Fanuc controller connects to the same platform as a new 5-axis center.
How long does it typically take to see OEE improvement after deploying machine monitoring?
Visibility-driven gains from operator behavior change often appear within the first few weeks. Larger availability improvements from maintenance optimization typically follow in months two through four, as the team uses alarm history and runtime data to shift from reactive repair to planned interventions.
What is the difference between OEE and machine utilization?
Utilization measures whether a machine is running versus idle. OEE measures whether it's running at the right speed, producing good parts, and available when scheduled — making it a far more complete and actionable picture of true productive output. A machine can show high utilization while still delivering poor OEE if it's running slow, producing scrap, or suffering frequent micro-stops.