Introduction
In most machine shops and CNC environments, jobs rarely sit still. Parts move through turning, milling, inspection, and finishing simultaneously — and keeping track of where everything stands is genuinely difficult. When WIP visibility breaks down, the consequences compound quickly: capital locked into unfinished goods, missed delivery dates, and ERP data that no longer reflects what's actually on the floor.
That breakdown has a measurable cost. A NIST study tracking 2005–2015 industry data found that average WIP flow time increased 98.8% while multifactor productivity declined 2.2% — a stark illustration of what happens when work piles up without effective controls.
What follows is a practical guide to WIP tracking: the metrics that matter, the habits that prevent bottlenecks, and how shops are moving from manual counts to real-time floor visibility.
Key Takeaways
- WIP covers all materials, labor, and overhead tied up in partially completed jobs, not just parts sitting on the shop floor
- Letting WIP grow unchecked creates bottlenecks, stretches lead times, and ties up cash flow even when machines appear busy
- Little's Law (Lead Time = WIP ÷ Throughput) proves that reducing WIP shortens lead time without buying new equipment
- Key metrics to monitor: cycle time, throughput, WIP per station, and flow efficiency
- Automated real-time data collection outperforms manual tracking on every dimension that matters
What Is WIP and Why Manufacturers Must Track It
Work in Progress is any item that has entered production but hasn't yet become a finished, shippable good. Under SEC Regulation S-X, WIP is a recognized inventory class required to be reported separately on the balance sheet — alongside raw materials, finished goods, and supplies. For accounting purposes, WIP carries the accumulated cost of direct materials, direct labor, and allocated overhead for every job still in process.
Tracking WIP for accounting compliance is only part of the picture. The more immediate pressure is operational: how much unfinished work is in your system, and what is it doing to your lead times?
Little's Law: The Math Behind WIP Management
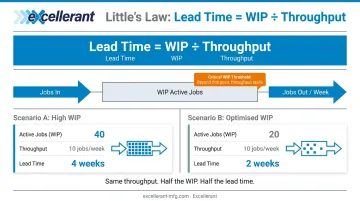
The most useful framework for understanding WIP's impact on flow is Little's Law:
Lead Time = WIP ÷ Throughput
A simple example makes this concrete. If your shop has 40 active jobs in process and completes 10 jobs per week, lead time is 4 weeks. Cut WIP to 20 jobs while holding throughput steady, and lead time drops to 2 weeks — no overtime, no new equipment.
The Project Production Institute adds an important caveat: pushing WIP above the system's critical WIP level doesn't increase throughput. Beyond that threshold, additional jobs in the queue raise cycle time by adding waiting time. Output stays flat while delays compound.
Cash Flow and Operational Risk
High WIP is a cash flow problem as much as an operational one. Every dollar tied up in an unfinished job is a dollar not generating revenue. APQC benchmarks the median inventory carrying cost at $19 per $1,000 of revenue across 1,024 companies — and that cost accumulates daily on every partially completed job.
Beyond cash, elevated WIP creates operational risk:
- Defects become harder to detect and trace when large batches sit between operations
- Root causes of quality problems get buried under accumulating inventory
- Scheduling turns reactive, with supervisors spending time hunting jobs instead of managing flow
WIP is a signal. When it climbs, something upstream (a bottleneck, a scheduling mismatch, batch overproduction) is creating accumulation. Real-time tracking turns that signal into a specific, addressable problem rather than a slow-building backlog.
Key WIP Metrics to Monitor on the Shop Floor
Four metrics drive effective WIP management. They're interconnected: a shift in any one of them will show up in the others.
Cycle Time
Cycle time is the total elapsed time for one unit to move from start to finish through an operation, including wait time between steps. The Lean Enterprise Institute defines it as the time required to produce a part or complete a process, measured by direct observation.
Rising cycle time is often the first indicator that WIP is creeping up or that flow between workstations is degrading. If cycle time on a particular operation suddenly trends upward, the queue feeding that station has grown.
Throughput
Throughput is the number of completed units in a given period — per shift, per day, per week. Flat or declining throughput combined with rising WIP signals a developing bottleneck. The system is accumulating inventory without converting it to finished goods.
WIP Per Station
Total WIP figures hide where inventory is actually building. Breaking WIP down by workstation is what makes bottlenecks visible. A station with disproportionately high WIP signals a constraint — whether that's a capacity shortfall, a tooling problem, or an upstream scheduling mismatch sending too much work too fast.
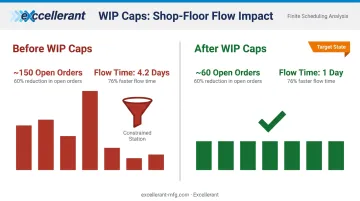
In a high-variety low-volume case study published in Production Planning and Control, implementing a fixed WIP cap reduced open orders from approximately 150 to 60 and cut strip-manufacturing flow time from 4.2 days to 1 day. Per-station visibility is what made that constraint fixable, not just observable.
Flow Efficiency
Flow efficiency measures what percentage of total lead time is actual value-adding work versus waiting. The Lean Enterprise Institute notes that in many processes, less than 10% of total elapsed time is value-adding — meaning most of a part's lead time is spent sitting, not being processed.
For job shops, this matters. Speeding up machines doesn't solve a flow efficiency problem. Reducing WIP does. When parts move through fewer handoffs with less queue time, flow efficiency improves and lead time shrinks with it.
WIP Tracking Best Practices for the Shop Floor
These practices apply to any discrete manufacturing environment (from high-mix low-volume job shops to higher-volume CNC production cells). The target isn't zero WIP. It's controlled, visible, predictable WIP.
Set WIP Limits by Station
A WIP limit defines the maximum number of jobs allowed at a workstation before upstream operations pause. When a station hits its limit, the signal is immediate and clear: work stops feeding into a saturated point rather than piling up invisibly.
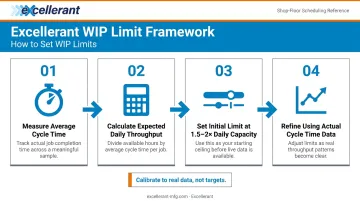
To set an initial limit:
- Measure the station's average cycle time
- Multiply by planned daily run rate to establish expected daily throughput
- Set the limit at 1.5–2x the station's daily capacity as a starting point
- Refine over time using actual cycle time data, not targets
Limits calibrated to real cycle times hold up in practice. Set them too aggressively and you'll starve downstream stations — a common mistake covered later in this guide.
Make Queues Visible in Real Time
If operators and supervisors can't see how much work is queued at each step, they can't respond to imbalances. Visual management of WIP (whether on a physical board, a floor monitor, or a digital dashboard) turns invisible accumulation into an actionable signal.
WIP counts need to be visible where decisions are made. A report checked at the end of a shift isn't visual management. A dashboard that updates as jobs move is.
Track and Categorize Blockers
Every time a job stalls, the reason should be recorded. Categories typically include:
- Machine downtime or fault
- Waiting on material or tooling
- Operator unavailable
- Waiting on inspection or quality hold
- Program or setup issue
Collecting this data consistently over weeks and months reveals the top recurring causes of WIP buildup. That's where targeted improvements pay off — fixing the top two or three root causes usually accounts for the majority of delay time.
Excellerant's shop floor interface includes a one-tap situation picker that lets operators categorize downtime reasons (personnel, material, tooling, machine malfunction) directly at the machine, feeding that context into the platform's historical downtime analysis.
Capture WIP Data Automatically
Manual WIP tracking (written logs, clipboard tallies, shift-end counts) always lags behind reality. By the time a supervisor reviews a handwritten count, the floor has moved on. Errors accumulate, discrepancies grow, and ERP data drifts from what's actually happening on the floor.
Connecting machines directly to a monitoring platform eliminates the lag. Job status updates automatically as work progresses, no manual entry required. C&M Machine Products, an Excellerant customer, found that after replacing manual data entry with automated collection: "The accuracy of information that's coming into our ERP system is exponentially better than what it was before."
Review and Tune Limits Regularly
WIP limits aren't set-and-forget. A limit that worked at last quarter's product mix may be wrong for today's. Schedule a regular cadence (monthly works for most shops) to review:
- Cycle time trends per station
- Throughput rates over the period
- Top blocker categories
- Any stations consistently hitting or exceeding their limits
Make small, data-driven adjustments rather than large reactive ones. The goal is steady improvement, not perfection on the first try.
How to Track WIP: From Manual Methods to Automated Systems
The Spectrum of Approaches
WIP tracking exists on a spectrum. At one end: whiteboard tallies, paper job travelers, and spreadsheet updates. At the other: fully connected real-time systems where job status updates automatically as parts move through operations.
Manual methods can work for small, simple operations — a single-shift shop with five machines and one product family. As complexity grows, manual tracking creates compounding problems:
- Data goes stale within hours of collection
- Shift-end counts don't reflect mid-shift conditions
- Supervisors spend time gathering information instead of managing flow
- ERP data diverges from shop floor reality
The more shifts, machines, and active jobs, the faster manual tracking breaks down.
Where ERP and MES Systems Fall Short
ERP and MES platforms can aggregate job status data and provide powerful production visibility — but only if the inputs are accurate and timely. The weakest link is typically the data entry step. When operators must manually log job completions or operation starts, updates lag by hours. Errors accumulate through miskeys and missed entries.
McMellon Bros. captures what accurate ERP integration actually looks like: after implementing Excellerant's platform, production manager Rory Miller noted, "ERP has become a more powerful tool. I can pull it up at any time and find out what's happening with a customer's parts. If we're not on pace, we can fix it." That's only possible when the data feeding ERP reflects what's currently happening — not what happened three hours ago.
Real-Time Machine Data Collection
Connecting shop floor equipment directly to a monitoring platform closes the gap between what's in the system and what's actually on the floor. Job status updates as machines cycle, downtime is captured automatically, and ERP receives accurate data without relying on operators to report it.
Excellerant's machine monitoring platform supports any mix of equipment — from legacy machines to modern multi-axis CNCs — through a broad range of protocols and connection methods:
- Modern CNCs: Ethernet or WiFi connectivity
- Legacy equipment: RS-232/serial or PLC adaptors
- Supported protocols: MTConnect, OPC-UA, Fanuc FOCAS, HAAS MNET, and Mazak Mazatrol
A decades-old manual machine and the newest 5-axis CNC report into the same dashboard with the same data fidelity.
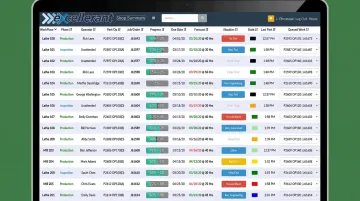
The Shop Summary Dashboard provides at-a-glance operational status of all connected equipment, real-time job-progress tracking, and schedule forecasting — accessible from any device, with no client installs required.
Common WIP Tracking Mistakes to Avoid
Setting WIP limits too tight without calibration. Limits set below a station's actual cycle time capacity starve downstream operations. Upstream work queues build while downstream machines sit idle; the constraint shifts rather than disappears. Fix: calibrate limits to measured cycle times, not aspirational targets, and adjust as you gather real data.
Treating the WIP pile as the problem. WIP accumulates near a constraint. The pile of parts you see is a symptom, not the cause. Teams that expedite jobs or add resources at the accumulation point without addressing the actual constraint will see the same problem reappear within days. WIP-per-station data identifies where the true constraint is. Fix it there, not where the visible pile happens to be.
Deploying tracking tools without operator engagement. Any tracking system, digital or paper, fails if the people using it find it adds friction without visible benefit. Operators who don't understand why WIP limits matter won't respect them. Those who see a system that creates more paperwork will find ways around it. To get operator buy-in:
- Involve operators in designing the tracking workflow from the start
- Keep data entry steps minimal — every extra tap is a barrier
- Show how the system benefits them directly: fewer surprises, less expediting chaos, less time hunting for jobs
Conclusion
WIP is a direct reflection of how well production flow is managed. When WIP grows unchecked, bottlenecks stay hidden, costs accumulate quietly, and delivery commitments slip. Controlled WIP means shorter lead times, more reliable on-time delivery, and machines and people working on the right things.
The combination of clear WIP limits, visible queues, categorized blocker tracking, automated data capture, and regular review creates a system that tightens lead times and surfaces problems before they compound. Start by identifying where your current tracking falls short — manual counts that lag, ERP data that doesn't match the floor, or station queues no one can see. Pick one gap and close it. Most shops find that closing even one visibility gap changes how the floor operates.
Frequently Asked Questions
How do you track work in progress?
WIP can be tracked through ERP/MES systems, physical shop floor boards, and automated machine monitoring tools. The most reliable method captures job status automatically as work moves through each operation — eliminating the lag and errors that come with manual updates.
What is a work-in-progress (WIP) tracker?
A WIP tracker is any system (from a spreadsheet to a real-time digital dashboard) that records how many jobs or units are at each stage of production. Effective trackers update continuously and display WIP counts where operators and supervisors can act on them immediately.
How does work in progress (WIP) affect the profit and loss (P&L) statement?
WIP represents costs — labor, materials, overhead — that have been incurred but not yet recognized as revenue. High or growing WIP ties up cash and can distort profitability reporting until jobs are completed and invoiced as cost of goods sold.
What are examples of work in progress (WIP)?
In a CNC environment: machined parts that have been cut but not yet inspected, a partially assembled aerospace component waiting on a sub-process, or raw stock that's been loaded and started but not finished.
What is a WIP limit and why does it matter in manufacturing?
A WIP limit caps how many jobs or parts are allowed at a given workstation before upstream operations pause. Limits prevent queues from building invisibly, make bottlenecks obvious the moment they form, and keep flow steady across the production line.
What is Little's Law and how does it apply to WIP management?
Little's Law states that Lead Time = WIP ÷ Throughput. It shows that lead time can be shortened by reducing WIP — without new equipment or additional staff.