
Introduction
On a busy shop floor, time is the one resource you can measure precisely—and lose quietly. A CNC cell running 8% slower than its ideal rate doesn't trigger alarms. Parts still come off the machine. Shifts still end on time. But that gap compounds across hundreds of operations, inflating cost per unit, pushing delivery dates, and hiding capacity that should be producing revenue.
Manufacturing cycle time is the metric that makes this visible. When tracked at the process level, it tells you not just that output is slow, but where and why.
This guide is written for production managers, machine shop operators, and operations leaders in aerospace, defense, and medical device manufacturing. It covers:
- What manufacturing cycle time is and its four core components
- How to calculate it accurately
- How cycle time relates to takt time and OEE
- Why it matters as a production KPI
- Concrete steps to reduce it
Key Takeaways
- Cycle time = net production time ÷ units produced — the actual speed of your process
- Four components: process time, inspection time, move time, and queue time (queue is usually the biggest waste)
- Takt time sets the required pace, cycle time measures the achieved pace — OEE Performance quantifies the gap
- Aligning cycle time with takt time prevents both underproduction and excess WIP
- Automated cycle time tracking replaces manual guesswork with continuous, real-time machine data
What Is Manufacturing Cycle Time?
Manufacturing cycle time is the elapsed time from when a unit enters active production to when it exits as a completed part. It includes every step that happens during production, covering both value-adding work and non-value-adding activities like waiting between steps or transferring between cells.
What's included:
- Active machining, assembly, welding, or other processing
- Quality inspection during or immediately after production
- Material movement between workstations
- Queue time (waiting for a machine, operator, or material)
What's excluded:
- Unplanned downtime and equipment breakdowns
- Planned maintenance and shift breaks
- Pre-production setup before the shift window begins
- Post-production activities like packaging and shipping
Keeping those categories separate is what makes the data usable. OEE.com distinguishes standard cycle time (measured while the process runs, unaffected by stop events) from effective cycle time, which folds in planned and unplanned stoppages. Treating them as the same produces misleading benchmarks.
Cycle time can be measured for an entire production line or for a single operation — a specific CNC machining step, a welding cell, or an inspection station. Process-level measurement is more diagnostic. Line-level averages can mask a single bottleneck station driving all the delay.
The Four Components of Manufacturing Cycle Time
The standard model, supported by managerial accounting frameworks and lean operations literature, breaks manufacturing cycle time into four components:
Process time — The actual work: machining, welding, assembly. This is the only value-adding component and the one most teams already try to optimize.
Inspection time — Time spent checking parts for defects or compliance. Rising inspection time signals a process reliability problem. As the Deming Institute notes, inspection doesn't improve quality — it only catches what's already gone wrong.
Move time — Time spent transferring materials, WIP, or finished parts between stations or cells. Excessive move time points to poor facility layout or workflow sequencing.
Queue time — The waiting period before work begins at the next step. A unit sits idle, waiting for a machine, operator, or material batch. Research published on ScienceDirect indicates that queue, wait-for-batch, and wait-to-match time can account for 90% or more of total manufacturing cycle time in many production environments.
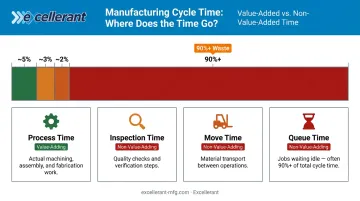
That 90% figure reframes the problem. In most shops, the largest cycle time reductions come not from faster cutting speeds, but from eliminating the idle time between operations.
Manufacturing Cycle Time Formula: How to Calculate It
The standard formula is straightforward:
Cycle Time = Net Production Time ÷ Units Produced
Net production time means total run time minus any recorded downtime events. The result reflects true production speed, not a number inflated by breakdowns or operator pauses.
Cycle Time Formula in Practice
Consider a CNC machining cell running an 8-hour shift (480 minutes). During the shift, the machine experienced one documented stoppage of 30 minutes, and the cell produced 90 completed parts.
- Net production time: 480 − 30 = 450 minutes
- Units produced: 90 parts
- Cycle time: 450 ÷ 90 = 5 minutes per part
Modern Machine Shop notes that a throughput-based calculation — total run time divided by acceptable (good) parts — is the more realistic shop-floor measure. Using total starts instead of good output understates actual cycle time when scrap or rework is present.
For shops running automated machine monitoring, the approach shifts from manual logging to timestamp data: subtract the first completion event from the last, remove documented downtime, and divide by total units minus one. This method is how production monitoring systems calculate cycle time continuously — without relying on operators to record anything.
What Is Ideal Cycle Time?
Ideal cycle time is the theoretical minimum time to produce one unit when the process runs at maximum demonstrated or designed speed — sometimes called nameplate or design speed. The gap between ideal and actual cycle time maps directly to the Performance component of OEE.
OEE.com defines Performance as:
(Ideal Cycle Time × Total Count) ÷ Run Time
When actual cycle time consistently runs above ideal, OEE Performance scores drop — even if the machine is available and producing good parts. Closing that gap is, in practical terms, what both cycle time reduction and OEE improvement work toward.
Cycle Time vs. Takt Time vs. Lead Time vs. OEE
These four metrics are frequently mentioned together and just as frequently confused. Each measures a different dimension:
| Metric | What It Measures | Formula |
|---|---|---|
| Cycle Time | Actual production speed per unit | Net production time ÷ units produced |
| Takt Time | Required pace to meet customer demand | Available time ÷ customer demand |
| Lead Time | Total time from order to delivery | Customer-facing, order-to-ship |
| OEE Performance | How closely actual speed matches ideal speed | (Ideal CT × total count) ÷ run time |
All three time metrics work together, each answering a different question. Cycle time reflects what your process is actually doing. Takt time reflects what customers need it to do. Lead time is what you communicate outward — the order-to-delivery window your customers plan around.
When Cycle Time and Takt Time Don't Align
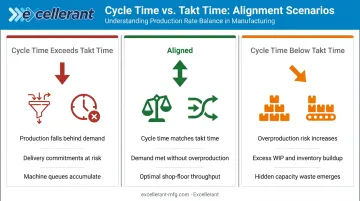
Two misalignment scenarios create real operational problems:
- When cycle time exceeds takt time, production falls behind demand. Capacity must increase, bottlenecks must be resolved, or cycle time reduced — otherwise customer commitments get missed.
- When cycle time runs below takt time, production outpaces demand. The result is excess WIP, inventory buildup, and wasted resources — not a sign of efficiency.
The goal is alignment, not maximum speed. In high-mix environments, takt time should be recalculated regularly — weekly or daily — as demand patterns shift. A cycle time target that made sense last week may be wrong this week.
Why Cycle Time Is a Critical Manufacturing KPI
Profitability and Throughput
Lower cycle time means more units produced per shift without adding capital equipment. That translates directly to lower labor and overhead cost per unit, wider margins, and more capacity for new work.
The relationship is described precisely by Little's Law from Factory Physics: WIP = Throughput × Cycle Time. Reduce cycle time while holding throughput constant, and WIP drops. Or hold WIP constant and throughput increases. Either way, the shop floor runs leaner.
Scheduling Accuracy and Delivery Reliability
When cycle time is stable and well-understood, production planners can commit to realistic delivery dates with confidence. When cycle time is variable or unknown, every promised ship date is a guess.
This matters everywhere, but it's especially consequential in regulated industries. Three standards directly tie schedule performance to compliance standing:
- IAQG 9100 (aviation, space, and defense quality systems) explicitly addresses supply chain schedule performance
- FDA's Quality Management System Regulation, effective February 2026, holds medical device suppliers to ISO 13485:2016 requirements where delivery consistency affects compliance standing
- FAR 52.211-11 exposes defense contractors to liquidated damages for late delivery — amounts vary by contract, but the financial risk is real
Bottleneck Identification
Because cycle time is measured at the station or process level, it pinpoints exactly where production flow slows. It doesn't just show that output is low — it shows where and why. That specificity makes cycle time one of the most actionable inputs for any continuous improvement effort.
Proven Tips to Improve Manufacturing Cycle Time
Map Value vs. Non-Value-Added Time First
Before optimizing anything, walk each step of the production process and categorize time as value-adding or non-value-adding. Queue time and unnecessary move time are the highest-leverage targets — and neither is visible without deliberate analysis.
Two lean tools that directly reduce cycle time:
- SMED (Single-Minute Exchange of Die): Reduces changeover to under 10 minutes by separating internal and external setup steps.
- 5S: Eliminates search time, excess motion, and disorganized material flow around machines — reducing move time and setup variability without any capital investment.
A pharmaceutical manufacturing case published in Procedia Manufacturing found a 30% reduction in major changeover time at a bottleneck process after 12 months of SMED application.
Identify and Attack the Bottleneck First
The slowest step in a multi-stage process sets the pace for the entire line. Improving any other station before fixing the constraint produces no cycle time reduction at the system level.
The Theory of Constraints approach is direct: find the bottleneck using cycle time data, subordinate everything else to it, and elevate its capacity before touching anything upstream or downstream. Optimizing a non-bottleneck station generates no throughput gain and can create WIP pile-ups that make the constraint worse.
The three-step sequence:
- Find the bottleneck using cycle time data across all stations
- Subordinate upstream and downstream operations to its pace
- Elevate bottleneck capacity before touching anything else
Use Preventive Maintenance to Protect Design Speed
Equipment degradation increases cycle time gradually, long before it causes a full breakdown. A spindle running at 7,200 RPM instead of its rated 8,000 RPM doesn't stop production — it just widens the gap between actual and ideal cycle time, dragging down OEE Performance scores on every shift.
TPM (Total Productive Maintenance) keeps machines running at design speed through proactive maintenance schedules. An integrated 5S/SMED/TPM case study from a 2025 LACCEI paper reported OEE improvement from 59.91% to 70.84% alongside setup-time reductions of 29.05%, demonstrating how these tools reinforce each other when applied together.

Break Down Cycle Time by Shift, Machine, and Operator
Averaging cycle time across a full shift hides the variation that tells the real story. A shop running three shifts may have one shift consistently running 15% longer cycle times — not because of the machine, but because of inconsistent standard work execution.
Excellerant's platform supports exactly this kind of analysis, breaking down cycle time and idle time by job, cycle, and shift. Comparing performance across shifts or machines often reveals that the root cause isn't mechanical — it's a training or standardization gap that's entirely correctable.
Using Real-Time Machine Data to Track and Improve Cycle Time
Manual stopwatch tracking has a documented accuracy problem. A 2013 study in Robotics and Computer-Integrated Manufacturing found that manual time measurements are too inaccurate and too time-consuming for regular use in complex shop-floor environments.
Automated machine monitoring solves this. Excellerant's platform captures cycle time data automatically from any CNC machine: Fanuc via FOCAS, HAAS via MNET, Mazak via Mazatrol, and standards-based equipment via MTConnect and OPC-UA. Legacy machines connect via RS-232/serial or PLC intermediary devices — no controller upgrades or machine modifications required — bringing 20- to 40-year-old equipment onto the same platform as new CNCs.
With real-time cycle time data flowing automatically, shop floor teams can:
- Compare actual cycle time against expected targets continuously
- Identify slow cycles as they happen, not at the end of the shift
- Analyze cycle time trends run-to-run, shift-to-shift, and week-to-week
- Surface performance gaps by machine, job, and shift

McMellon Bros., an Excellerant customer featured in Modern Machine Shop, reported that real-time production visibility transformed how they manage pace: "If we're not on pace, we can fix it." That response becomes possible only when cycle time data arrives in real time, not at the end of the shift.
Frequently Asked Questions
How does cycle time differ from takt time and OEE?
Cycle time measures actual production speed per unit. Takt time sets the required pace to meet customer demand. OEE measures overall equipment effectiveness — with cycle time feeding directly into OEE's Performance factor via the ideal-to-actual cycle time ratio. All three work together but measure different dimensions of production performance.
Is cycle time a KPI?
Yes. Cycle time is a core manufacturing KPI used to measure production speed, diagnose bottlenecks, forecast output, and calculate cost per unit. It's tracked alongside OEE, takt time, and lead time as part of a standard production performance dashboard.
How do you measure cycle time?
Two approaches: manually (stopwatch measurements divided by units produced, using good parts in the denominator) or automatically via machine sensors or monitoring software that capture completion events and calculate cycle time continuously against an ideal target. Automated measurement is far more accurate in complex or high-volume environments.
What is ideal cycle time in manufacturing?
Ideal cycle time is the theoretical minimum time to produce one unit at maximum demonstrated machine speed — nameplate speed. It serves as the benchmark against which actual cycle time is compared to quantify speed loss and calculate the Performance component of OEE.
What are the four components of manufacturing cycle time?
Process time (value-adding production), inspection time (quality checks), move time (material transfers between stations), and queue time (waiting between steps). Queue time is typically the largest source of non-productive cycle time — often the majority of total elapsed time on the shop floor.
How does reducing cycle time improve profitability?
Shorter cycle times allow more units to be produced within the same window, lowering labor and overhead cost per unit without capital investment. Faster throughput also supports quicker delivery, which strengthens customer retention and competitive positioning — especially in aerospace and defense environments where on-time delivery is a contractual requirement.