
Introduction
Picture a machine shop running two shifts, five days a week. The machines are humming, operators are busy, and OEE looks reasonable. Out of all 168 hours in a week, though, how many are actually producing good parts?
For a two-shift, five-day operation, that's roughly 80 scheduled hours — meaning 52% of the week sits completely idle before a single breakdown or quality issue is counted.
That gap is what Total Effective Equipment Performance (TEEP) measures. It forces the question most manufacturers avoid: not just "how well are we running when scheduled?" but "how much of the available clock are we actually using?"
This article covers what TEEP is, how it differs from OEE and OOE, how to calculate it with a worked example, and how to use it as a lens for capacity decisions.
Key Takeaways
- TEEP measures productive output as a percentage of all calendar time (24/7/365), not just scheduled production hours
- The formula is TEEP = OEE × Utilization, which extends OEE by accounting for Schedule Losses — the unscheduled hours OEE ignores
- A single-shift shop running 85% OEE still lands at roughly ~20% TEEP. That gap is the hidden factory.
- TEEP isn't a target to hit; it's a tool for deciding whether to add shifts, reschedule maintenance, or invest in new equipment
- Accurate TEEP tracking requires continuous, automated machine data because manual logs distort the picture
What Is Total Effective Equipment Performance (TEEP)?
According to OEE.com, TEEP is a performance metric that provides insight into the "true capacity" of a manufacturing operation — specifically, what percentage of all calendar time is genuinely productive. Unlike most production metrics, which are anchored to planned production hours, TEEP accounts for every hour of every day — shifts, nights, weekends, and holidays alike.
The Two Loss Categories TEEP Captures
TEEP accounts for two distinct types of losses:
- Equipment Losses (captured by OEE): unplanned downtime, reduced speed, and quality defects that occur during scheduled production
- Schedule Losses (captured by Utilization): all the hours outside scheduled production — nights, weekends, holidays, and any time the machine isn't running at all
OEE measures what happens while equipment runs. TEEP also measures how much time it wasn't running in the first place.
The Four Underlying Factors
TEEP is built on four components:
| Factor | What It Measures |
|---|---|
| Availability | Actual run time as a percentage of planned production time |
| Performance | Actual output rate compared to ideal (nameplate) speed |
| Quality | Good parts produced as a percentage of total parts started |
| Utilization | Planned production time as a percentage of all calendar time |
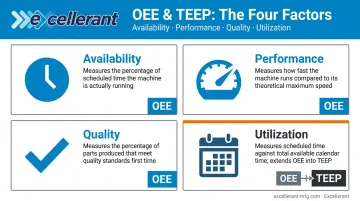
The first three factors feed into OEE. Add Utilization and you get TEEP.
Who Uses TEEP — and Why
TEEP isn't a floor-level metric. It's a strategic tool for operations managers and plant leadership evaluating whether the business is fully using the assets it already owns before committing to new equipment purchases. When a customer asks if you can handle more volume, TEEP tells you the real picture.
TEEP vs. OEE vs. OOE: Understanding the Differences
These three metrics measure the same underlying reality — productive output — but against different time baselines. That difference in denominator produces sharply different scores for the same factory.
OEE: The Operational Baseline
OEE measures what percentage of planned production time is truly productive. If a machine is scheduled to run an 8-hour shift and the plant doesn't schedule Saturday, OEE doesn't count Saturday at all. It's a pure measure of operational effectiveness during scheduled hours — excellent for troubleshooting specific equipment losses.
OOE: The Middle Tier
OOE (Overall Operations Effectiveness) widens the denominator to include all time the machine is scheduled to be available — meaning planned maintenance windows, shift changeovers, and similar structured stoppages count against the score. Any reason a machine is taken offline during operating hours appears as a loss. OOE is most useful for evaluating whether shift structures and maintenance scheduling are efficient.
TEEP: The Full Picture
TEEP uses all calendar time as the denominator. A machine sitting idle on a Sunday reduces TEEP exactly the same as a breakdown on Tuesday morning. No hours are exempt.
Same Factory, Three Different Scores
Consider a CNC machine scheduled to run one 8-hour shift, five days a week, with a few planned maintenance windows built into the schedule:
- OEE might read 78% — measuring how well the machine ran during planned production hours
- OOE drops to perhaps 65% — once maintenance windows and changeovers eat into available time
- TEEP falls to around 18% — because 40 scheduled hours out of 168 available is only 23.8% Utilization, multiplied by OEE
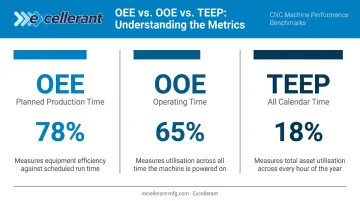
Each score reflects a different question about that same factory — which is exactly what makes choosing the right metric so important.
When to Use Each Metric
| Metric | Best For |
|---|---|
| OEE | Monitoring production efficiency; diagnosing equipment-level losses |
| OOE | Evaluating shift structures and maintenance scheduling efficiency |
| TEEP | Strategic questions: "Can we take on more orders without buying new machines?" |
How to Calculate TEEP: Formula and Step-by-Step Example
The formulas, per Vorne's TEEP reference:
- OEE = Availability × Performance × Quality
- Utilization = Planned Production Time ÷ All Calendar Time
- TEEP = OEE × Utilization
- TEEP (expanded) = Availability × Performance × Quality × Utilization
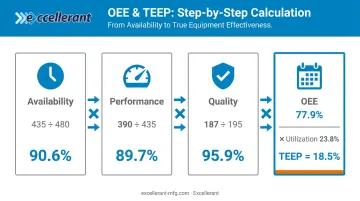
Calculating OEE First
Take a CNC machining center running one 8-hour shift, five days a week (40 hours/week planned production time).
Availability:
- Shift time: 480 minutes
- Unplanned downtime: 45 minutes (tool changes, minor jams)
- Run time: 435 minutes
- Availability = 435 ÷ 480 = 90.6%
Performance:
- Ideal cycle time: 2.0 minutes per part
- Parts produced: 195
- Performance = (195 × 2.0) ÷ 435 = 89.7%
Quality:
- Total parts: 195
- Scrap/rework: 8
- Good parts: 187
- Quality = 187 ÷ 195 = 95.9%
OEE = 90.6% × 89.7% × 95.9% = 77.9%
That's a solid single-machine OEE result — short of the OEE.com world-class benchmark of 85%, but respectable for a real production environment.
Calculating Utilization and TEEP
With OEE established at 77.9%, the next step is factoring in how much of the calendar week this machine was actually scheduled to run:
- Planned Production Time: 40 hours/week
- All Calendar Time: 168 hours/week
- Utilization = 40 ÷ 168 = 23.8%
TEEP = 77.9% × 23.8% = 18.5%
That's the number that tells the real story. Even with a respectable OEE, this machine is producing good parts at full speed for less than one-fifth of available calendar time.
What 100% TEEP Would Mean
A 100% TEEP score would require the machine to run continuously — 24 hours a day, 365 days a year — producing only good parts at full speed with zero stops. No real operation achieves that. The practical value of TEEP is in quantifying the gap — how much productive capacity exists in calendar time versus how much the business is actually capturing — and deciding where targeted recovery makes business sense.
What TEEP Reveals: The Hidden Factory
The "hidden factory" is the production capacity sitting inside equipment a manufacturer already owns, going unused during unscheduled hours. OEE.com defines it as additional production that can be unlocked without capital investment. TEEP makes that invisible capacity visible by expressing it as a percentage gap.
In the example above, 81.5% of available capacity is unrealized. A single-shift operation is a deliberate business choice. TEEP converts that choice from a vague assumption into a quantified number, which is when it becomes useful.
Three Ways to Read the Gap
The same TEEP gap can be expressed three ways, each useful for a different conversation:
- Lost units: additional good parts that could have been produced in unused hours — the number sales and capacity planning teams actually need
- Lost hours: idle productive time quantified for labor scheduling and shift decisions
- Percentage gap: the summary figure for benchmarking against past performance or industry targets
Why Accurate Data Matters Here
Those three expressions of the gap are only meaningful if the underlying data is accurate. Manual operator logs and paper-based records introduce estimation errors that distort all four TEEP components, particularly Availability and Quality, where subjective reporting is most common.
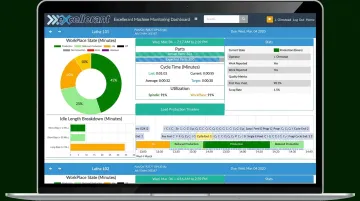
Platforms like Excellerant's machine monitoring system address this by automatically capturing machine status timelines, cycle times, part counts, and conforming/nonconforming quality data directly from CNC equipment, including machines 20 to 40 years old via RS-232 serial connections. That continuous data stream keeps TEEP calculations current, replacing periodic manual tallies with a live, objective record.
As Modern Machine Shop has noted, machine monitoring produces more accurate, detailed, timely, and objective data and can increase productivity by 10% to 20% simply by making performance data visible.
How to Improve Your TEEP Score
Before taking any action, diagnose which component is actually dragging the score. Fixing the wrong lever wastes resources.
If Utilization Is the Problem
A low Utilization score means the machine simply isn't scheduled to run enough. The levers here are scheduling decisions:
- Add an evening or weekend shift
- Move planned maintenance to already-idle overnight periods (nights and weekends are already lost to TEEP — maintenance there costs nothing additional)
- Redistribute work from overloaded machines to underutilized ones
If OEE Is the Problem
A low OEE with decent Utilization means the machine is scheduled adequately but running poorly. The focus shifts to operational improvement:
- Reduce unplanned downtime through better preventive maintenance
- Address speed losses by investigating why cycle times exceed ideal
- Improve first-pass quality to reduce scrap and rework pulling down the Quality component
Track TEEP as a Trend, Not a Snapshot
Once you know which lever to pull, tracking what happens next is what turns a fix into a result. A single TEEP calculation is interesting; a trend line is actionable — TEEP's value compounds over time as improvements in scheduling, maintenance strategy, and equipment performance show up clearly in consistent data.
Research from MESA International and LNS found that manufacturers achieving OEE of 80% or better reported average annual financial improvements of 14%, compared to 8.6% for all other respondents. The gap between those groups isn't coincidence — it reflects the compounding benefit of measuring consistently and acting on what the data shows.
Excellerant's analytics dashboard includes run-to-run, week-to-week, and year-to-year comparison tools built for this purpose. When TEEP updates continuously from automated machine data, trend analysis becomes something your team does without thinking about it — not a quarterly reporting exercise.
Frequently Asked Questions
What is total effective equipment performance?
TEEP is a manufacturing KPI that measures what percentage of all calendar time (24/7/365) is spent producing good parts at full speed. It captures both equipment-level losses (downtime, speed losses, quality defects) and scheduling losses — time when production isn't running at all.
How do you calculate OEE?
OEE = Availability × Performance × Quality, where Availability is run time divided by planned production time, Performance is actual output rate divided by ideal rate, and Quality is good parts divided by total parts. The result shows what percentage of scheduled production time was truly productive.
What's a good OEE score?
OEE.com cites 85% as the widely accepted world-class benchmark, with scores around 60% typical for manufacturers actively working on improvement. Scores below 45% signal significant inefficiencies that warrant immediate investigation.
What is a good TEEP score?
There's no universal TEEP benchmark because it's inherently schedule-dependent — a single-shift plant simply can't reach the same TEEP ceiling as a facility running 24/7. TEEP is most useful as a directional metric: track it over time within your own operation rather than against an external standard.
What is the difference between TEEP and OEE?
OEE measures efficiency during scheduled production hours only. TEEP extends this by multiplying OEE by Utilization — the share of total calendar time that's actually scheduled for production. TEEP always produces a lower score than OEE and reveals the additional capacity sitting in unscheduled hours.