According to the Manufacturing Leadership Council's 2024 survey, 70% of manufacturers still collect data manually — and only 56% collect at least half of their manufacturing data in real time. That gap between data and decision-making is exactly what manufacturing analytics dashboards are built to close.
This article covers five real-world manufacturing analytics dashboard examples across the most common use cases, the KPIs worth tracking, and the design and implementation practices that separate dashboards people actually use from ones that collect digital dust.
Key Takeaways
- Most manufacturers still rely on manual data collection — real-time dashboards eliminate that lag
- Five dashboard types matter most: production overview, OEE, machine status/downtime, quality control, and predictive maintenance
- KPI selection should be role-driven, not data-driven — operators, supervisors, and executives need different views
- The 5-second rule: a well-designed dashboard communicates status at a glance — no studying required
- Data connectivity is the hardest implementation step, particularly when integrating legacy equipment with older protocols
What Is a Manufacturing Analytics Dashboard?
A manufacturing analytics dashboard is a real-time visual interface that pulls production data from machines, operators, and systems into a single display. Instead of waiting for end-of-shift reports or manually compiling spreadsheet data, supervisors and managers see live KPI status — and can act on it while there's still time to make a difference.
That's different from a generic BI dashboard. A financial dashboard tracks revenue, pipeline, and headcount. A manufacturing dashboard tracks machine states, cycle times, job progress, and downtime causes — events happening on the shop floor right now.
Those tracked events mean different things depending on who's reading them. Each role on the floor needs a different view:
- Operators need to know whether their machine is running against target — right now
- Supervisors need a line-by-line shift comparison to spot where output is slipping
- Executives need throughput and cost summaries, not raw machine states
One dashboard can't serve all three well — and trying to force it means it serves none of them well.
5 Manufacturing Analytics Dashboard Examples
Production Overview Dashboard
Think of this as mission control for the plant — a high-level, shift-wide summary of what's happening across every active production line. At a glance, it shows:
- Units produced vs. daily target
- First-pass yield by line or shift
- Operator output comparisons across shifts
- Line-level status with drill-down into individual machines
- Safety status and open alerts
Primary users: Plant managers and supervisors. This is the first screen they check at shift start or during stand-up meetings. If everything is green, they move on. If a line is red, they drill in.
The real advantage is speed. A supervisor who previously walked the floor or collected paper logs can now assess plant-wide status in under 30 seconds.
OEE (Overall Equipment Effectiveness) Dashboard
OEE measures equipment productivity across three components: Availability × Performance × Quality. An OEE dashboard displays these values in real time for individual machines or entire fleets, using color-coded indicators (green/yellow/red) so supervisors can scan the whole shop at a glance.
OEE.com describes 85% as a commonly cited world-class benchmark, with roughly 60% being typical when manufacturers first start tracking. The gap between those numbers represents significant recoverable capacity.
When a machine drops below target, the dashboard pinpoints which component is responsible:
- Availability drop → machine is idle or down
- Performance drop → running slower than standard cycle time
- Quality drop → producing rejects
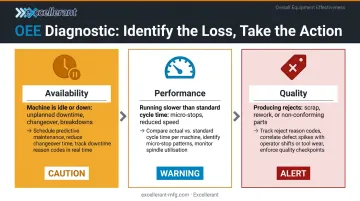
That distinction turns a number into an action. Platforms like Excellerant's machine monitoring software calculate all three OEE components in real time — broken down by machine, shift, and job — so supervisors catch performance gaps during the shift, not after it.
Machine Status & Downtime Dashboard
This dashboard shows every connected machine's current state: running, idle, in setup, or down. The most useful versions don't just show that a machine is down — they show why, categorized by cause.
Excellerant's Shop Floor Interface captures downtime reasons through a one-tap situation picker that lets operators categorize each event — personnel, material, tooling, or machine malfunction — directly from a tablet at the machine. The system also captures automatic machine alarm states and fault codes without requiring any operator input, giving a complete picture of downtime causes.
This dashboard type does require machine-level data connectivity. Excellerant's platform supports all major CNC protocols for modern machines:
- MTConnect
- OPC-UA
- Fanuc FOCAS
- HAAS MNET
- Mazak Mazatrol
- Heidenhain TNCremo
For legacy equipment — RS-232 serial CNCs, behind-the-tape-reader machines, or 30- and 40-year-old controls — connectivity comes through serial communications or PLC intermediary devices, so even older equipment feeds the same dashboard without manual entry.
Quality Control Dashboard
A quality dashboard moves monitoring from end-of-batch inspection to an in-process alert system. It displays defect rates, scrap counts, and conforming versus nonconforming part quantities by machine, line, or shift — updated as parts come off the line.
In Excellerant's platform, operators assign good vs. scrap quantities through the Shop Floor Interface, which pushes that data to the ERP in real time. The OEE Quality component surfaces this data at the machine level, so a supervisor can see a live defect count against the shift target rather than discovering a quality problem in the next morning's report.
Role-specific value:
- Quality engineers use trend views to spot process drift before it compounds
- Supervisors see live scrap counts and can intervene mid-shift
- ERP systems receive accurate conforming part counts without manual labor tickets
Maintenance Dashboard
A maintenance dashboard tracks machine health indicators, upcoming PM schedules, and equipment runtime since last service. Its core purpose is shifting maintenance from reactive (fixing things after they fail) to condition-aware (knowing which machines are at risk before they go down).
McKinsey research indicates predictive maintenance can reduce machine downtime by 30–50% and extend machine life by 20–40% in industrial settings.
Useful maintenance dashboards display:
- Equipment runtime since last service
- Historical downtime frequency by machine
- Open work orders and maintenance windows
- Alerts flagging machines trending toward failure
Excellerant's platform tracks machine status timelines and provides usage-based maintenance visibility, so maintenance teams work from a prioritized list of at-risk equipment instead of waiting for something to break.
Key KPIs Your Manufacturing Analytics Dashboard Should Track
KPI selection should start with decisions, not data. Ask: what does this person need to decide, and what metric informs that decision? A screen with 30 metrics serves no one — cognitive load research from dashboard designer Stephen Few indicates short-term memory handles roughly 3–9 chunks of visual information effectively.
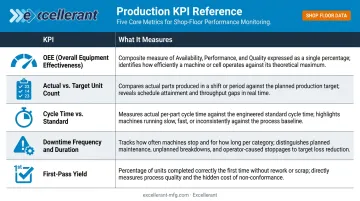
Core Production KPIs
| KPI | What It Measures |
|---|---|
| OEE | Availability × Performance × Quality — the single most comprehensive machine productivity metric |
| Actual vs. target unit count | Whether the line is tracking to the shift goal in real time |
| Cycle time vs. standard | Whether machines are running at expected speed or drifting |
| Downtime frequency and duration | How often machines stop and how long each event lasts |
| First-pass yield | Percentage of parts meeting spec without rework |
Machine Utilization Metrics
Tracking the ratio of active cutting time to total available time exposes hidden capacity losses that production counts alone won't reveal. In CNC job shops, idle machine time is idle revenue potential. Utilization metrics make that visible before the shift ends, not after the fact on a morning report.
A capable monitoring platform should surface this data in real time. Excellerant's platform, for example, provides:
- Machine-status timelines showing active, idle, and downtime states
- State charts comparing productive vs. non-productive time
- Run-to-run utilization comparisons across weeks and months
Leading vs. Lagging Indicators
Most dashboards lean too heavily on lagging indicators — metrics that confirm what already happened, like daily scrap count or end-of-shift OEE. Leading indicators warn before problems occur:
- Lagging: yesterday's scrap count, last shift's OEE
- Leading: cycle time trending upward, utilization dropping across a shift
A well-designed dashboard prioritizes a mix of both. Lagging indicators confirm outcomes; leading indicators give operators a window to act before the outcome is set.
Manufacturing Dashboard Design Best Practices
The 5-Second Rule
A manufacturing dashboard should communicate its most critical status information within 5 seconds of someone glancing at it. If a supervisor has to study the screen to understand what's happening, the design has already failed.
Practical guidance: limit each dashboard view to the 5–7 KPIs that drive immediate action for that specific role. Everything else belongs in a secondary view.
Visual Hierarchy and Color Discipline
- Place highest-priority metrics top-left (where the eye naturally starts)
- Use element size to signal importance — larger means more critical
- Limit color to three semantic states: green (on target), yellow (watch), red (act now)
Decorative color use creates confusion on a busy shop floor — color signals status, and nothing else.
Role-Specific Views
Excellerant's platform is built around this model. Each role gets a purpose-built view tied to the same underlying data:
- Operators — tablet-optimized Shop Floor Interface showing machine status and task queue
- Supervisors — shift metrics, line comparisons, and forecasting tools
- Executives — Shop Summary Dashboard with plant-wide operational status and scheduling intelligence
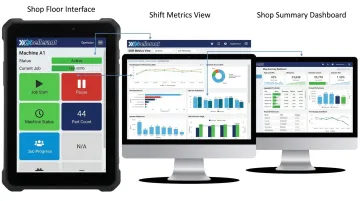
A single dashboard trying to serve all three audiences ends up serving none of them. Separate views, shared data.
The Drill-Down Principle
The top-level dashboard answers: what is happening?
One click deeper should answer: why?
Keep overview dashboards clean. Push detail — downtime reason codes, historical trend charts, individual part counts — into secondary views. This prevents the overview from becoming a data dump that no one can read at a glance.
Alert Design
Clean information hierarchy only works if critical alerts break through it. Alerts must be visible and persistent — an alert buried in a secondary tab, or one that clears without acknowledgment, defeats its purpose. For shop floor environments:
- Require acknowledgment before alerts clear
- Consider pairing visual alerts with audible notifications for high-priority events
- Make sure alerts are visible from across the floor, not just from directly in front of the screen
How to Implement a Manufacturing Analytics Dashboard
Step 1: Solve the Data Connectivity Problem First
The most common implementation failure has nothing to do with dashboard design — it starts with poor data sourcing. Before choosing any visualization tool, identify every data source: machines, MES, ERP, and manual inputs. Then determine how data will flow into the dashboard in real time.
For modern CNCs, connectivity is straightforward — ethernet or WiFi. Legacy machines require more planning. Excellerant connects RS-232 serial CNCs, behind-the-tape-reader machines, and older controls through serial communications or PLC intermediary devices, with wireless DNC adaptors available for shops that want to avoid new cabling.
ERP integration is handled bi-directionally out of the box, covering systems including:
- SAP, Oracle, and Epicor
- JobBoss and Global Shop Solutions
This step is where most shops underestimate the work involved — especially facilities with a mixed fleet of old and new equipment.
Step 2: Phase the Rollout
Once your data connections are mapped, resist the urge to build every dashboard at once. Scope creep and low adoption follow when implementation tries to do everything in parallel.
Start with one dashboard type tied to your most painful operational problem — often a machine status view or OEE dashboard for the shop floor. Prove its value in 30–60 days, then expand. Involve operators and supervisors in defining what they need to see — not just IT or management.
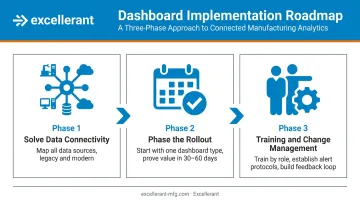
Step 3: Plan for Training and Change Management
A dashboard no one trusts is just an expensive screen.
- Train each role on how to read and act on their specific view
- Establish clear protocols for responding to alerts
- Build a feedback loop so the dashboard evolves based on how teams actually use it
Excellerant's platform is browser-based — no client installs required, accessible from any device. The Shop Floor Interface is tablet-optimized with touch-friendly controls specifically designed for operators on the floor. That simplicity reduces adoption friction, but it doesn't eliminate the need for deliberate training and change management.
Frequently Asked Questions
What is a manufacturing analytics dashboard?
A manufacturing analytics dashboard is a real-time visual interface that consolidates shop floor data — machine states, production output, quality metrics — into role-specific displays. It replaces lagging manual reports with live KPI visibility, enabling faster, data-driven decisions across operators, supervisors, and executives.
What is manufacturing analytics?
Manufacturing analytics is the practice of collecting, processing, and analyzing data from production processes to improve efficiency, quality, and decision-making. It spans real-time monitoring, historical trend analysis, and predictive insights derived from machine and operational data.
What are the 4 types of dashboards?
The four types are operational (real-time status), analytical (trend analysis), strategic (executive KPI summaries), and tactical (short-term tracking for supervisors). Manufacturing dashboards often blend these depending on the audience and use case.
What is the 5-second rule for dashboards?
The 5-second rule states that a dashboard should communicate its most critical information within 5 seconds of viewing. In manufacturing, this means limiting each view to a small number of high-priority KPIs with clear visual hierarchy, so shop floor personnel can assess status at a glance.
What KPIs should be on a manufacturing dashboard?
Core KPIs include OEE (Availability, Performance, Quality), actual vs. target unit count, cycle time vs. standard, downtime frequency and cause, and first-pass yield. KPI selection should match the role of the dashboard user — an operator's view differs significantly from an executive summary.
How does machine data get into a manufacturing analytics dashboard?
Machine data reaches dashboards via protocols like MTConnect, OPC-UA, Fanuc FOCAS, HAAS MNET, or Mazak Mazatrol, with serial/RS-232 adaptors and PLC devices handling legacy equipment. MES and ERP integrations feed additional context. The connectivity layer is typically the most complex part of implementation, especially in shops running a mix of old and new machines.