
Manufacturing KPIs (Key Performance Indicators) solve that. They translate raw machine and production data into quantifiable numbers tied to specific operational goals — so teams can stop guessing about downtime, scrap, and delivery failures and start fixing them.
According to the Manufacturing Leadership Council, 70% of manufacturers still collect data manually, even as collected data volumes have doubled in the past two years. That gap between data volume and actionable insight is exactly where KPIs earn their value.
This guide covers the 12 most critical manufacturing KPIs — organized by category, with formulas, benchmarks, and what each metric actually tells you on the shop floor.
Key Takeaways
- Manufacturing KPIs are quantifiable measures tied to specific operational goals, not generic numbers tracked out of habit.
- The 12 KPIs covered span four categories: equipment efficiency, quality, production throughput, and cost.
- Start with three to five KPIs tied to your biggest pain points — too many metrics dilutes focus.
- Real-time machine data makes KPIs actionable — paper logs and stale data lead to lagging decisions.
- Role-based dashboards — for operators, supervisors, and management — determine whether metrics actually change behavior.
What Are Manufacturing KPIs and Why Do They Matter?
A manufacturing KPI is a well-defined, quantifiable measure used to evaluate operational performance against a specific business goal. That last part matters. A plain metric tells you what happened — a KPI tells you whether what happened was acceptable.
The distinction becomes financial fast. A 2024 Siemens/Senseye study estimates unplanned downtime costs the world's 500 largest companies nearly $1.4 trillion annually — roughly 11% of revenues. For automotive manufacturers, the figure reaches $2.3 million per hour on an idle production line. Even at the SME level, unplanned downtime can reach $150,000 per hour.
Those losses are preventable — but only when shops are tracking the right things in the first place.
That said, the opposite failure is just as common: tracking too many KPIs and drowning in noise. A facility monitoring 20 metrics simultaneously tends to act on none of them. The right KPIs depend entirely on what the business is trying to improve — reducing scrap, increasing throughput, eliminating unplanned breakdowns, or some combination of all three.
The 12 Manufacturing KPIs You Need to Track
These 12 KPIs are organized into four operational categories. Each includes a formula and a plain-language explanation of what strong versus weak results indicate.
Equipment Efficiency KPIs
1. Overall Equipment Effectiveness (OEE)
Formula: OEE = Availability × Performance × Quality
OEE is the closest thing manufacturing has to a universal machine health score. Each component isolates a distinct failure mode:
- Availability — is the machine running when it should be?
- Performance — is it running at its intended speed?
- Quality — is it producing good parts?
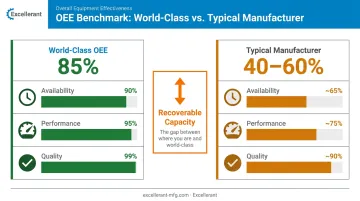
According to OEE.com, a world-class OEE benchmark sits at 85% (built from approximately 90% availability, 95% performance, and 99% quality). Most discrete manufacturers fall between 40–60% when they first start tracking. That gap — 25 to 45 percentage points — represents recoverable capacity that doesn't require a single new machine.
Excellerant's platform calculates OEE automatically from connected machine data, breaking it down by machine, shift, and job in real time.
2. Machine Downtime Rate
Formula: Downtime Hours ÷ (Downtime Hours + Operational Hours)
Not all downtime is equal. Scheduled downtime — planned maintenance, tooling changes, setup — is manageable. Unscheduled downtime (unexpected breakdowns, alarm states, material jams) is the primary target for any downtime reduction program and the clearest lever for recovering available production time.
Tracking downtime rate alone isn't enough. The value comes from categorizing why machines stop. Excellerant's platform captures every stoppage automatically and lets operators categorize reasons — personnel, material, tooling, machine malfunction — with a one-tap picker right at the machine. That categorization turns a time-based metric into root-cause data.
3. Capacity Utilization
Formula: Actual Output ÷ Total Productive Capacity
A high utilization rate signals efficient asset use. A low rate raises different questions: Are shifts fully staffed? Is scheduling creating idle gaps? Are certain machines bottlenecking the line?
Capacity utilization also carries strategic weight — many job shops use it to inform quoting and order acceptance decisions. If a facility is running at 60% utilization, it has room to take work. At 90%, accepting a rush order has real trade-offs. Modern Machine Shop's Top Shops data shows top-performing CNC shops achieve median spindle utilization of 75%, versus 65% for other shops.
Quality KPIs
4. First-Pass Yield (FPY)
Formula: Quality Units ÷ Total Units Produced
FPY captures the percentage of parts that meet specification on the first attempt — no rework, no scrap. APQC benchmarks the cross-industry median at 95%, though CNC and job-shop environments often see wider swings based on part complexity.
Low FPY is expensive in a way that's easy to undercount. Every reworked part consumed machine time, operator time, and material — then consumed more of all three to fix. The cost of poor quality ranges from 5% to 35% of sales, averaging around 15%, according to IISE research. A 90% FPY on a high-volume line isn't a minor quality issue; it's a structural cost problem.
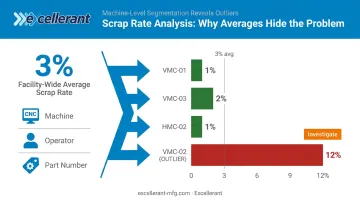
5. Scrap Rate
Formula: Scrap Units ÷ Total Units Produced
Unlike rework, scrap is a total loss. The material, machine time, and operator hours are gone with no recovery. The trap many shops fall into is treating scrap as fixed overhead rather than something to investigate.
Tracking scrap rate by machine, operator, or part number isolates root causes instead of averaging them away. A scrap rate of 3% facility-wide might hide a single machine running at 12% — and fixing that one machine transforms the number.
6. Defects Per Million Opportunities (DPMO)
Formula: (Total Defects ÷ Total Units Produced) × 1,000,000
DPMO is the standard quality metric in Six Sigma programs. According to ASQ, a process operating at the Six Sigma level produces just 3.4 defects per million opportunities — near-perfect process control.
This metric becomes most relevant for facilities producing precision aerospace, defense, or medical components where tolerance for defects is extremely low. For job shops running high-mix, lower-volume work, FPY and scrap rate are often more practical daily measures.
Production & Throughput KPIs
7. Throughput
Formula: Units Produced ÷ Time Period
Throughput is the most direct measure of whether production capacity is being realized. It answers the simplest question on the shop floor: are we making parts fast enough?
Comparing throughput across shifts, machines, or operators surfaces gaps that scheduling and utilization numbers miss. Consistent underperformance on second shift, for example, typically points to one of three causes:
- Staffing gaps or inexperienced operators on that shift
- Setup problems that weren't resolved from first shift
- Machine performance degradation that accumulates through the day
The data tells you which one — without guesswork.
8. Cycle Time
Formula: Process End Time − Process Start Time
Cycle time can be measured at the individual operation level or across an entire production run. Reducing cycle time without sacrificing quality is a core goal of lean manufacturing — but the reduction has to be data-driven.
Excellerant's platform tracks precise cycle times for every operation, compares actual against expected cycle times, and flags deviations in real time. When a part program that should run in 4 minutes starts running in 6, the system surfaces it — rather than letting the shift-end report reveal it hours later.
9. On-Time Delivery (OTD)
Formula: (Units Delivered On-Time ÷ Total Units Delivered) × 100
OTD is a lagging indicator — by the time it's poor, the damage is done. But it's also a reliable signal of upstream dysfunction. Chronic OTD failures almost always trace back to machine downtime, scrap-driven reruns, or scheduling failures that compound over days.
Modern Machine Shop's Top Shops data shows top CNC shops achieve 95% on-time delivery versus 90% for other shops — a gap that often represents the difference between repeat customers and lost contracts. APQC's cross-industry median for complete, on-time delivery sits at 90%.
Cost & Financial KPIs
10. Manufacturing Cost Per Unit
Formula: Total Manufacturing Cost ÷ Units Produced
This KPI captures all costs — materials, labor, overhead, maintenance — on a per-part basis. It's essential for accurate quoting, profitability analysis, and identifying where cost reduction will have the most impact.
For job shops, the quoting connection is direct. Modern Machine Shop data shows manufacturers returning quotes within two hours have win rates exceeding 90%, while shops taking five days or more drop below 5%. Knowing your actual cost per unit — not an estimate — is what makes fast, accurate quotes possible without guessing at margin.
11. Inventory Turnover Rate (ITR)
Formula: Cost of Goods Sold ÷ Average Inventory
A low ITR means capital is sitting on shelves — raw materials, WIP, or finished goods that aren't moving. A high ITR can indicate stockout risk. APQC's cross-industry benchmark places the median at 8.0 inventory turns, with raw material inventory running closer to 10.0 turns.
Improving ITR means aligning procurement with actual production schedules and demand forecasts — not historical reorder patterns built around a production mix that no longer exists.
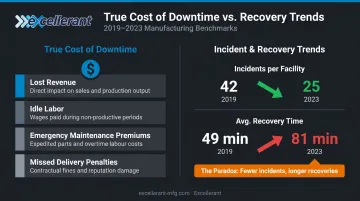
12. Cost of Downtime
Formula: Lost Revenue + Lost Productivity + Cost to Recover
This KPI puts a dollar figure on what downtime actually costs — not just the immediate lost production, but the full recovery picture:
- Expedited shipping to meet missed deadlines
- Idle labor during unplanned stoppages
- Emergency maintenance premiums
- Missed delivery penalties
The numbers add up faster than most shops expect. The same Siemens/Senseye research found that while downtime incidents per facility fell from 42 to 25 monthly between 2019 and 2023, average recovery time per incident rose from 49 to 81 minutes — meaning fewer incidents but longer, costlier recovery periods. Tracking cost of downtime — not just downtime hours — forces that full picture into the conversation.
How to Prioritize the Right KPIs for Your Operation
The most common mistake is tracking everything at once. A practical approach: start with three to five metrics tied directly to the operation's biggest pain points, then expand only as those improve.
Leading vs. Lagging Indicators
A balanced dashboard includes both types:
| Indicator Type | Examples | What It Tells You |
|---|---|---|
| Leading | Maintenance completion rate, in-process defect counts | Predicts future performance — allows early action |
| Lagging | OTD, scrap rate, cost per unit | Confirms past outcomes — validates improvement |
Leading indicators let teams act before a problem becomes a trend. Lagging indicators confirm whether interventions are working. A dashboard weighted too heavily toward lagging metrics leaves you reacting; too many leading metrics without outcome validation makes it hard to judge progress. Balance both.
Three Requirements for a Reliable KPI
Any KPI without these three elements will drift into noise:
- A clearly defined data source — where does the number come from?
- A consistent measurement method — is it calculated the same way every time?
- A target and review cadence — operational KPIs weekly, financial KPIs monthly
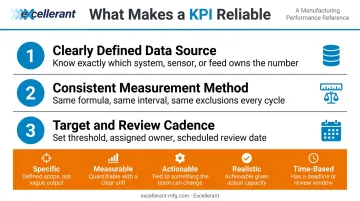
Apply a SMART framework to every metric you adopt: Specific, Measurable, Actionable, Realistic, and Time-Based. A metric without a defined target and review schedule is just a number — it won't drive decisions.
How to Track Manufacturing KPIs in Real Time
The value of any KPI is tied directly to the freshness of the data behind it. A scrap rate calculated from yesterday's paper logs cannot drive action on today's shift.
Real-time machine data collection is what converts a KPI from a reporting exercise into a decision-making tool. Yet the Manufacturing Leadership Council reports that 70% of manufacturers still enter data manually — so most KPI dashboards are running on information that's already hours or days old.
IIoT Machine Monitoring: How It Works
When machines are connected to a monitoring platform, cycle counts, downtime events, part counts, and alarm states flow automatically — eliminating manual entry errors and providing accurate, up-to-the-minute KPI data.
Excellerant's machine monitoring platform connects any mix of new and legacy CNC equipment to a unified cloud platform using universal connectivity:
- Modern CNCs — plug-and-play ethernet or WiFi connection
- Legacy equipment — RS-232 serial, behind-the-tape-reader (BTR), or PLC intermediary devices
- Protocol support — Fanuc FOCAS, HAAS MNET, Mazak Mazatrol, MTConnect, OPC-UA, Heidenhain TNCremo
A 30-year-old machine and a brand-new machining center can run on the same platform simultaneously. No equipment replacement required.
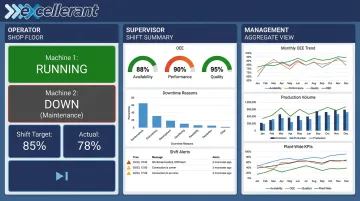
Role-Based Data Views
Once that data flows in real time, the platform surfaces it differently depending on who's looking:
- Operators see real-time machine status, shift targets, job progress, and part counts via the Shop Floor Interface
- Supervisors get shift-level OEE, downtime trends, production forecasting, and bottleneck alerts via the Shop Summary Dashboard
- Management accesses weekly and monthly aggregates across lines or facilities, connected to financial outcomes through ERP integration
Excellerant integrates with ERP platforms including SAP, Oracle, Epicor, JobBoss, and Global Shop Solutions — sending live machine data upstream while pulling job and work-order data back to the floor.
Conclusion
The 12 KPIs covered here — spanning equipment efficiency, quality, throughput, and cost — give manufacturing operations a clear picture of where performance stands and where to focus improvement efforts:
- OEE surfaces machine health and utilization gaps
- FPY and scrap rate expose where quality processes are breaking down
- OTD reveals whether production scheduling is keeping pace with demand
- Cost per unit anchors every quoting and profitability decision
But none of them work reliably on manual data collection. If your shop is still running KPIs off paper logs and end-of-day entries, the metrics are always behind the problem.
Excellerant's IIoT machine monitoring platform connects any machine — new or legacy — and streams live performance data directly to your dashboards, so every KPI reflects what's happening on the floor right now. Reach out to the Excellerant team to see how real-time machine monitoring can put accurate, current data behind every metric you track.
Frequently Asked Questions
How do you measure KPIs in manufacturing?
Define a formula (for example, OEE = Availability × Performance × Quality), collect consistent data from machines and production records, then compare results against a target on a set cadence. Automated machine monitoring eliminates manual entry errors and delivers real-time data, making measurement significantly more accurate.
What are the most important KPIs to include on a manufacturing KPI dashboard?
OEE, machine downtime rate, first-pass yield, on-time delivery, and manufacturing cost per unit are the most universally critical starting points. The right mix still depends on your facility's specific challenges — a shop with a scrap problem should weight FPY and scrap rate more heavily than one whose primary issue is scheduling.
What are examples of good manufacturing KPI dashboards?
Effective dashboards are tiered by audience:
- Operators see real-time machine status and shift progress
- Supervisors see shift-level OEE and downtime breakdowns
- Management sees weekly and monthly trends across lines or facilities
Each view should show only the metrics that audience can act on — not everything the system can produce.
What is OEE and why is it the gold standard manufacturing KPI?
OEE (Overall Equipment Effectiveness) combines availability, performance, and quality into a single score showing how close a machine or line is to operating perfectly. It captures the three most common sources of production loss in one number, making it straightforward to benchmark across machines, shifts, and facilities.
What is the difference between a KPI and a metric in manufacturing?
A metric is any measurable data point — total units produced, for example. A KPI is a metric tied to a specific performance goal or target, such as throughput must meet X units per shift. Metrics provide context; KPIs drive decisions.
How often should manufacturing KPIs be reviewed?
Operational KPIs (OEE, downtime, cycle time) should be reviewed in real time or at every shift handover. Quality KPIs (scrap rate, FPY) are best reviewed weekly, and financial KPIs (cost per unit, inventory turnover) monthly — with formal cross-team reviews tied to quarterly improvement planning.