Introduction
For facility managers, CNC shop owners, and operations leads in aerospace, defense, and medical manufacturing, the gap between what machines are doing and what the front office knows is expensive. Deloitte estimates unplanned downtime costs industrial companies $50 billion annually, yet 70% of manufacturers still enter production data manually, according to the Manufacturing Leadership Council.
Real-time machine monitoring closes that gap — it's the continuous collection, transmission, and visualization of live operational data from manufacturing equipment, giving shop floor teams the ability to act on what's happening now.
The terminology makes this harder than it needs to be. "Machine monitoring," "MES," and "IIoT" get used interchangeably even though they describe different layers of the same system. This guide breaks down how each layer works, what MES and IoT each contribute, and what separates a monitoring implementation that actually improves performance from one that just generates reports.
Key Takeaways
- Real-time machine monitoring surfaces live CNC data (machine state, cycle counts, OEE, alarms) while production is running
- IoT hardware is the data acquisition layer; MES is the intelligence layer that makes that data actionable
- Modern and legacy machines speak different protocols — MTConnect, OPC-UA, FANUC FOCAS — so connectivity strategy matters
- Dashboards nobody acts on don't reduce downtime; value comes from connecting data to real decisions
What Is Real-Time Machine Monitoring?
Real-time machine monitoring tracks machine status, cycle counts, spindle utilization, alarm events, and operating conditions during active production. Unlike end-of-shift reports, it delivers continuous visibility into what every machine is doing right now.
The outcome it's designed to achieve: shop floor supervisors and operations managers can see exactly what's happening across the floor and respond before a problem becomes a production impact.
What It Is Not
Machine monitoring gets confused with adjacent concepts. The distinctions matter:
- CMMS (Computerized Maintenance Management System) — manages maintenance records and work orders; doesn't provide live machine data
- Production monitoring — tracks output across workflows and processes; broader scope than individual machine states
- Data logging — records historical machine data after the fact; not continuous, not action-oriented
Understanding these distinctions sets the foundation for where MES integration and IoT connectivity fit into the picture — which is where real-time monitoring becomes a system rather than a standalone tool.
How MES and IoT Power Real-Time Machine Monitoring
The two technologies serve distinct functions, and confusing them leads to incomplete implementations.
IoT hardware — sensors, edge devices, machine controllers — captures raw signals at the machine and gets that data moving. The MES receives it, gives it context, and turns raw signals into operational intelligence your team can act on.
What the MES Layer Does
Once raw machine signals arrive at the MES, the work begins:
- Maps machine signals to active production orders
- Compares actual cycle times against planned standards
- Calculates OEE continuously across the floor
- Triggers alerts when thresholds are exceeded
- Connects shop floor activity to ERP and front-office systems
That context is what separates a raw data feed from a system your supervisors and schedulers can actually use.
The Protocol Challenge
Making machine connectivity work across a real shop floor requires communication standards. Each controller vendor exposes data differently, and a shop with 40 machines spanning multiple brands and three decades of technology needs a protocol-agnostic approach — one that translates machine-specific outputs into a normalized format the MES can interpret. Common protocols include:
- MTConnect
- OPC-UA
- FANUC FOCAS
- HAAS MNET
- Mazak Mazatrol
- Heidenhain TNCremo
Excellerant, which holds voting membership on the MTConnect Standards Committee, is built specifically for this multi-protocol environment. The platform supports all six protocols above, acting as a protocol converter and gateway that connects any mix of machines — modern or legacy — into a single monitoring environment.
The Single Source of Truth
When machines, operators, and schedules feed into a single system, the siloed information problem disappears. The MES consolidates that data into one view rather than leaving each process isolated from the others. When a machine goes down, supervisors see it in real time: the system logs the event, captures the reason code, and ties the downtime directly to its impact on the production schedule.
How Real-Time Machine Monitoring Works: The Data Flow
The end-to-end flow follows a consistent path regardless of machine type or platform:
Machine generates signals → IoT hardware captures and transmits → data is normalized → MES processes and displays → alerts trigger on threshold breaches → data stores for trend analysis
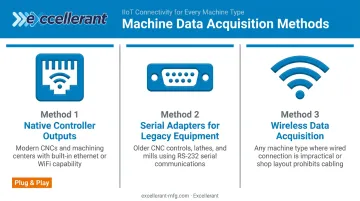
Step 1: Data Acquisition at the Machine
Data collection at the machine level happens through three primary methods:
- Native controller outputs — modern CNCs with built-in data ports (ethernet or WiFi) connect directly; for many machines this is as simple as plugging in a cable
- Serial adapters for legacy equipment — RS-232 serial-controlled CNCs, behind-the-tape-reader machines, and older controls connect through serial communications or PLC intermediary devices without modifying the machine or its controller
- Wireless data acquisition — wireless DNC adaptors bridge older serial machines onto the network for shops where running physical cables is impractical
Excellerant's approach, built on 30 years of machine tool networking experience, connects machines from any era — legacy equipment included — alongside modern CNCs on a single platform, without requiring machine replacement.
Step 2: Data Transmission and Normalization
Raw machine signals are machine-specific. A FANUC controller exposes alarm codes differently than a HAAS or Mazak. Before the MES can use the data, it needs to mean the same thing regardless of source.
This is where protocol translation happens. Edge software or middleware converts machine-specific outputs — FANUC alarm codes, spindle load percentages, cycle time signals — into standardized data fields the MES can interpret. Excellerant's platform acts as a machine-tool protocol converter, translating non-uniform data streams into a consistent format before they reach the analytics layer.
Step 3: Visualization, Alerting, and Action
Once normalized data reaches the MES, three things happen simultaneously:
- Live dashboards display machine states (running, idle, alarm, offline), part counts, cycle times, and OEE scores — updated continuously
- Configurable alerts push to supervisors via mobile app or dashboard when a machine goes down, a cycle time deviates beyond tolerance, or part counts fall behind schedule
- Operator reason-code entry allows floor operators to classify downtime events at the machine — Excellerant's one-tap situation picker lets operators categorize downtime by cause (personnel, material, tooling, machine malfunction) without interrupting workflow
That reason-code data is what separates a system that tells you a machine stopped from one that tells you why it stopped — and whether the same cause keeps repeating.
Where Real-Time Machine Monitoring Is Applied
Manufacturing Environments That Benefit Most
- High-mix, low-volume CNC job shops — frequent changeovers make unplanned downtime disproportionately expensive; monitoring reveals where setup time and idle time are hiding
- High-volume production lines — even small cycle time variations compound across thousands of parts; continuous visibility catches drift before it becomes scrap
- Aerospace, medical device, and defense manufacturing — traceability and process stability aren't optional; monitoring creates the documented production record these sectors require
McMellon Bros., a 36-employee CNC job shop, found that machine monitoring transformed their ERP from a records system into a live operational tool. As Rory Miller described it: "I can pull it up at any time and find out what's happening with a customer's parts. If we're not on pace, we can fix it."
Common Triggers for Implementation
Shops typically reach the decision point when one or more of these conditions persists:
- Unplanned downtime with no clear root cause
- Inability to accurately forecast job completion times
- Poor ERP data accuracy from manual time entry
- Management requests for OEE visibility
C&M Machine Products, a high-volume precision manufacturer in New Hampshire, addressed the data accuracy problem directly. After implementing monitoring, their ERP data accuracy improved dramatically — in the words of Dan Villemaire: "The accuracy of information that's coming into our ERP system is exponentially better than what it was before."
Monitoring Is Ongoing, Not a One-Time Project
Addressing those triggers is only the starting point. Once monitoring is running, historical data accumulates and value builds: maintenance intervals can be tied to actual machine usage, recurring downtime patterns surface across shifts, and quoting accuracy improves because cycle time data comes from real production — not estimations or memory.
Key Factors That Affect Real-Time Machine Monitoring Effectiveness
Technical Factors
| Factor | What It Means in Practice |
|---|---|
| Machine age and protocol diversity | Older machines require serial adapters or PLC intermediaries; mixed fleets need protocol-agnostic connectivity |
| Network infrastructure | Reliable wired or wireless coverage is a prerequisite for consistent data transmission |
| Data normalization approach | Machine-specific outputs must be standardized before the MES can interpret them meaningfully |
Deloitte's 2025 smart manufacturing survey found only 54% of manufacturers use a data standard through a unified data model — meaning nearly half are collecting data that isn't normalized or structured for use across systems.
That gap shows up on the shop floor in concrete ways. A shop with ten identical CNCs from the same manufacturer is straightforward to connect. A shop with 40 machines spanning 30 years of manufacturing technology and five different controller brands requires an entirely different connectivity strategy — one built around protocol flexibility rather than assuming a uniform environment.
Organizational Factors
The technology can be sound and the implementation can still fail. Common organizational gaps:
- Undefined KPIs before deployment — if no one decides what the system should measure before go-live, dashboards get viewed but not acted upon
- Operators not entering reason codes — without downtime classification, the system records that machines stopped but can't identify patterns
- Alerts without response workflows — real-time alerts only create value if someone is accountable for responding to them
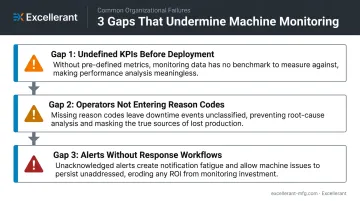
The data is only as useful as the processes built around it. Without defined ownership and response workflows, even a well-configured monitoring system produces reports that no one acts on.
Common Misconceptions About Real-Time Machine Monitoring
"We'd have to replace our older machines." Not accurate. Legacy CNCs connect via retrofit serial adapters, RS-232-to-network bridges, or PLC intermediary devices that interface with existing controllers without modifying the machine. AMT has documented this approach in a published MTConnect use case for legacy equipment, and Modern Machine Shop described Ethernet-to-RS-232 connectivity for legacy CNCs specifically. The machine stays. The hardware translator does the work.
"Having live data will automatically reduce downtime." Data doesn't improve performance — acting on data does. The monitoring system identifies where problems exist. Without a defined process for responding to alerts and reviewing downtime trends, the system produces reports rather than results. The implementation question isn't just "can we see the data?" — it's "what will we do differently because of it?"
"If we implement monitoring, the system will manage itself." Shops that deploy monitoring without first defining what decisions the data will inform often end up with underutilized dashboards. Before go-live, the more useful questions are:
- Who reviews alerts, and when?
- What's the response process when OEE drops below threshold?
- Which KPIs map to actual business outcomes?
Frequently Asked Questions
What is a real-time monitoring system?
A real-time monitoring system combines hardware and software to continuously capture live machine data, transmit it to a central platform, and surface it through dashboards and alerts — giving operators and managers decision-relevant information while production is still running, not after the shift ends.
What are the three types of monitoring?
The three common categories are: automated machine data monitoring (native controller outputs or edge devices), sensor-driven monitoring (retrofitted sensors for machines without built-in connectivity), and operator-driven monitoring (manual entry at terminals or tablets). Most effective implementations use all three together.
What is the difference between MES and IoT in machine monitoring?
IoT is the hardware and communication layer that captures and transmits raw machine data; MES is the software layer that receives, organizes, and acts on it. Treating them as the same thing leads to implementations where data is captured but never connected to production decisions.
Can real-time machine monitoring work with legacy CNC machines?
Yes. Legacy machines connect using serial-to-network adapters, wireless DNC adaptors, or PLC intermediary devices that interface with older controller types — no machine modification required. The key is using a monitoring platform built to handle multiple protocols and machine generations rather than one that assumes modern, IoT-native equipment.
What data does real-time machine monitoring collect?
Common data points include machine state (running, idle, alarm, offline), cycle counts and cycle times, spindle load and speed, alarm codes and fault events, part counts, and job progress against planned schedules. Operator-entered reason codes add context to downtime events.
How does real-time machine monitoring support predictive maintenance?
Monitoring systems track patterns like gradual cycle time increases, rising alarm frequency, and spindle load deviations to surface early warning signs of wear before a breakdown occurs. Excellerant's predictive rule engine feeds machine and sensor data into analytics, alerting maintenance teams to developing issues rather than reacting after failure.