Reactive maintenance feels cheaper in the moment. You fix what breaks, pay the repair bill, and move on. But when you examine the full cost picture — emergency labor rates, expedited freight, secondary damage, scrap from degrading equipment — the math shifts dramatically.
This guide walks through the real cost of CNC machine downtime, the key ROI drivers of downtime reduction systems, and a step-by-step framework for calculating your return on investment before you spend a dollar on technology.
Key Takeaways
- Siemens/Senseye's 2024 research estimates the world's 500 largest companies lose roughly $1.4 trillion annually to unplanned downtime — about 11% of revenue
- Predictive maintenance cuts machine downtime by 30–50% and extends machine life by 20–40%, per McKinsey
- The U.S. DOE documents maintenance cost benchmarks showing reactive programs cost roughly twice as much per horsepower annually compared to predictive programs
- 95% of predictive maintenance adopters report positive ROI — and 27% recover their investment within a year (IoT Analytics)
The Real Cost of CNC Machine Downtime
Most shops track repair costs. Few track the full economic impact of a stoppage. Production loss is the largest and most variable component — calculated simply as hourly production value × hours down. For a machine generating $200/hour in output value, 300 hours of annual unplanned downtime equals $60,000 in lost production before a single repair bill is considered.
Repair costs are just the starting point — the categories below are where the real damage accumulates.
Direct Costs That Are Easy to Measure
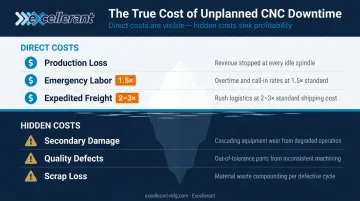
Two direct costs compound production loss with every unplanned failure:
- Emergency labor: The U.S. Department of Labor mandates overtime at 1.5× the regular rate for non-exempt employees past 40 hours. Weekend callouts, holiday emergencies, and union provisions push that multiplier higher. BLS data shows manufacturing already averages 4.0 overtime hours per week — failures push technicians deeper into premium-rate territory.
- Expedited parts: Standard lead times are irrelevant when a machine is down. Logistics industry data shows expedited freight runs 2–3× standard service rates, and for high-value industrial components, overnight freight charges often exceed the part cost itself.
Hidden Costs That Don't Show Up on the Repair Invoice
These are the costs that make reactive maintenance genuinely expensive:
- Secondary damage: A bearing failure detected late rarely stops at the bearing. SKF documents that consequential damage extends to shafts, housings, seals, and neighboring assemblies — making the original component a fraction of the final repair bill.
- Quality and scrap: Degraded CNC equipment produces out-of-tolerance parts before the failure is obvious enough to trigger a stoppage. NIST research tied machinery maintenance problems to $0.8 billion in defects and $100.2 billion in lost sales across U.S. discrete manufacturing. The scrap accumulates silently while the machine keeps running.
Key ROI Drivers of a Downtime Reduction System
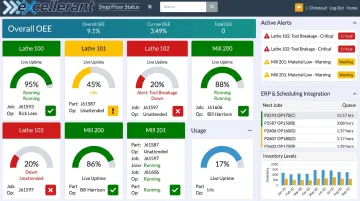
What Real-Time Monitoring Actually Captures
Before you can reduce downtime, you need to see it clearly. Real-time machine monitoring captures:
- OEE (Overall Equipment Effectiveness) broken into availability, performance, and quality components
- Machine status timelines showing productive, idle, and downtime periods for every shift
- Unplanned stop events logged automatically without requiring operator input
- Downtime categorization by cause — personnel, material, tooling, or machine malfunction
- Cycle times and part counts per job, allowing run-to-run and week-to-week comparison
Without this data, downtime causes remain invisible. You know machines stopped; you don't know why, for how long, or how often the same issue recurs.
Excellerant's machine monitoring platform collects this data from any machine brand or protocol — MTConnect, OPC-UA, Fanuc FOCAS, HAAS MNET, Mazak Mazatrol, and legacy RS-232 serial connections — giving shops a single view across their entire floor, whether equipment is brand new or 40 years old.
From Reactive to Planned: The Repair Cost Differential
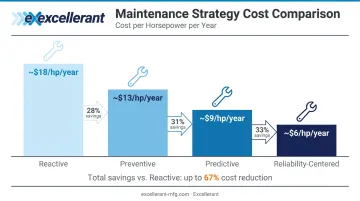
The financial case for condition-based intervention comes down to when you act. The DOE's Operations & Maintenance Best Practices Guide documents clear cost differences across maintenance strategies:
| Maintenance Strategy | Benchmark Cost |
|---|---|
| Reactive | ~$18/hp/year |
| Preventive | ~$13/hp/year |
| Predictive | ~$9/hp/year |
| Reliability-Centered | ~$6/hp/year |
Reactive programs cost twice as much per asset per year as predictive programs — before accounting for emergency labor premiums, expedited freight, secondary damage, and production loss that accompany unplanned failures.
When monitoring surfaces a developing issue early, maintenance schedules the repair during planned downtime at standard labor rates with standard-lead-time parts. The same repair, performed reactively, triggers every cost multiplier simultaneously.
Condition-Based vs. Calendar-Based Scheduling
Calendar-based preventive maintenance replaces components on fixed intervals regardless of actual condition. Some components are replaced healthy. Others fail between scheduled intervals anyway. Condition-based maintenance, enabled by real-time data, intervenes when the data says it's necessary — not when the calendar does.
The DOE benchmarks quantify the difference:
- Preventive delivers 12–18% cost savings over reactive maintenance
- Predictive/condition-based adds another 8–12% savings over preventive
- Functional predictive programs reach 25–30% total cost reduction versus reactive baselines
Extended Machine Lifespan
Consistent monitoring prevents the catastrophic failures that cause collateral damage and trigger premature asset replacement. McKinsey's manufacturing analytics research puts predictive maintenance's lifespan extension at 20–40% for monitored assets versus reactive maintenance programs. For a $250,000 machining center, a 20% lifespan extension represents $50,000 in deferred capital expenditure.
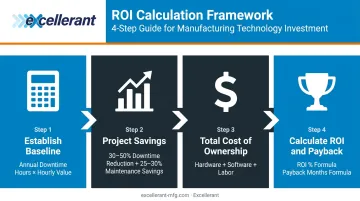
How to Calculate Your Downtime Reduction ROI Step by Step
Step 1 — Establish Your Baseline
Calculate your current annual downtime cost:
Annual downtime cost = Unplanned downtime hours × Hourly production value
Example: A shop with 20 CNC machines experiences an average of 300 hours of unplanned downtime annually. Each machine generates roughly $150/hour in production value.
- Production loss: 300 hours × $150 = $45,000
- Add emergency labor premium (assume 200 labor hours at 1.5× standard $35/hr rate = $3,500 premium above standard)
- Add expedited freight (assume $8,000 annually in emergency parts procurement vs. standard ordering)
- Add estimated secondary damage and scrap: $6,000
Estimated annual downtime cost: ~$62,500
Substitute your own numbers to establish the baseline you'll carry through Steps 2–4.
Step 2 — Project Your Savings
Apply documented industry benchmarks to your baseline:
- Downtime reduction: McKinsey's 30–50% range applied to $45,000 in production loss = $13,500–$22,500 in recovered production value
- Maintenance cost reduction: DOE's 25–30% predictive maintenance savings applied to an annual maintenance budget of $80,000 = $20,000–$24,000 in reduced repair costs
Projected first-year savings: $33,500–$46,500
These are conservative estimates — shops with higher downtime baselines, higher machine utilization rates, or more frequent emergency repairs will see larger returns.
Step 3 — Determine Total Cost of Ownership
For a mid-sized shop running 10–30 CNC machines, the three cost components are:
- Hardware and connectivity infrastructure: IIoT hardware, serial adaptors for legacy machines, and network infrastructure. Ranges vary by machine count and the mix of modern vs. legacy equipment.
- Software platform licensing: server-based platform with unlimited user access and no per-seat fees. Contact Excellerant at sales@excellerant-mfg.com for current pricing scoped to your machine count and configuration.
- Internal labor to administer the program: minimal after initial deployment — most shops report under two hours per week once configured, given browser-based access and plug-and-play connectivity for modern CNCs.
Step 4 — Calculate ROI and Payback Period
ROI formula:
(Annual Benefits ÷ Total Investment) × 100 = ROI %
Payback period:
Total Investment ÷ Annual Benefits × 12 = Payback in months
Using the example above:
- Annual benefits: $40,000 (midpoint of projected savings range)
- Assumed total system investment: $35,000
($40,000 ÷ $35,000) × 100 = 114% first-year ROI $35,000 ÷ $40,000 × 12 = 10.5-month payback
Presenting Your ROI Case Internally
Once you have these numbers, how you frame them matters — especially for ownership or a CFO. Not all savings look the same on paper.
- Avoided costs are counterfactual: production not lost, repairs not performed at emergency rates. Document these against your pre-implementation baseline and track them separately.
- Realized cash savings are measurable line items: reduced labor hours, lower parts procurement costs, fewer overtime charges. These show up directly in budget comparisons.
CFOs will scrutinize avoided-cost claims. Lead with realized savings and use avoided costs as supporting evidence backed by clear methodology.
Implementation: Reducing Time-to-ROI
Getting to positive ROI faster comes down to a few key decisions made at the start of implementation.
Deploy monitoring on your 5–10 highest-cost assets first. Early wins on critical assets build organizational confidence and give you clean baseline-vs-improvement data before expanding to the full floor. Excellerant's platform scales from a single machine to an entire facility, so a phased rollout is straightforward.
Don't exclude legacy machines. Many shops assume older equipment can't be connected and skip it entirely. Excellerant's universal connectivity supports RS-232 serial CNCs, BTR machines, and other legacy controls — including equipment that's 20, 30, or 40 years old — through serial communications or PLC intermediary devices. Unmonitored legacy machines carry the highest failure risk and the least visibility when something goes wrong.
Two factors that directly affect payback speed:
- ERP integration — when machine data flows into scheduling and ERP systems automatically, production forecasting improves alongside downtime reduction. Excellerant integrates bi-directionally with SAP, Oracle, Epicor, JobBoss, and Global Shop Solutions.
- Team adoption — a monitoring platform only delivers ROI when the maintenance team acts on alerts. Adoption speed is the single biggest variable in how quickly payback is achieved.
Strategic Benefits Beyond Cost Savings
Cost reduction is the primary ROI driver, but three strategic benefits extend the value of a downtime reduction system.
Delivery Reliability as a Competitive Differentiator
Shops with lower unplanned downtime can commit to tighter lead times and meet on-time delivery rates consistently. In aerospace, defense, and medical device manufacturing, this is a measurable differentiator. Government contracts under FAR 52.211-11 can include liquidated damages clauses for late delivery, meaning a missed commitment carries a contract-defined cost, not just a relationship cost.
Shop Floor-to-Front-Office Visibility
When real-time machine status flows to scheduling and management, production managers stop building excessive buffer time into quotes to cover unknown downtime risk. Excellerant's finite dynamic scheduler responds automatically: when an unplanned stoppage occurs, schedules update against actual shop floor conditions rather than static assumptions.
Safety and Compliance Documentation
Well-monitored equipment reduces unexpected mechanical failures that create operator safety incidents. OSHA's machine guarding guidelines note that moving machine parts can cause crushed hands, amputations, and other severe injuries when failures occur unexpectedly.
Medical device manufacturers face an additional documentation requirement: 21 CFR 820.70(g) mandates recorded equipment maintenance schedules and activity logs. Excellerant's per-machine event logging and alarm-state tracking directly supports this requirement.
Frequently Asked Questions
What does a 20% ROI mean?
A 20% ROI means the investment returned $0.20 net gain for every dollar spent — a total return of 120% of the initial investment. For a $30,000 system investment, 20% ROI equals $6,000 net gain above the cost of the investment.
What is ROI in a management control system?
In a management control system, ROI refers to the financial return generated by deploying systems that monitor and optimize operational performance. For machine monitoring platforms, it's measured by comparing total system cost against documented savings in downtime, maintenance, and labor.
What is ROI in ITIL?
ITIL (IT Infrastructure Library) ROI refers to value realized from IT service management practices. In manufacturing technology, the concept is similar but measured differently : through production uptime gains, maintenance cost reductions, and avoided capital expenditure rather than IT service desk metrics.
How do you calculate ROI for a machine downtime reduction system?
Use: (Annual Benefits from Downtime and Maintenance Savings ÷ Total System Investment) × 100. Annual benefits should include realized cash savings (labor and parts cost reductions) and avoided costs (lost production), each tracked separately against your pre-implementation baseline.
How long does it take to see ROI from machine monitoring?
Most facilities identify previously hidden downtime causes within the first 60–90 days of deployment. IoT Analytics reports 27% of predictive maintenance adopters recover their full investment in under one year, depending on baseline downtime levels and how quickly the team acts on alerts.
What is a good ROI for a manufacturing technology investment?
Industry benchmarks suggest a well-implemented downtime reduction system can deliver 3–10× ROI over three years. Payback periods under 18 months are strong for manufacturing capital investments in this category.